Monitoring on-premises infrastructure is critical to avoid costly downtime, which can average $300,000 per hour. The right tools help IT teams identify and resolve issues before they escalate, ensuring smooth operations and compliance with security standards. Here's a quick breakdown of five popular monitoring tools:
- Datadog: SaaS-based with 900+ integrations, AI-driven insights, and a starting price of $15/host/month.
- Dynatrace: Combines AI-powered monitoring with automatic discovery, priced at $0.04/hour/host.
- Prometheus + Grafana: Open-source and free, ideal for those with technical expertise to manage setup and scaling.
- ManageEngine OpManager: Offers agentless monitoring starting at $95 (one-time fee), suitable for smaller deployments.
- Zabbix: Free open-source tool with enterprise-grade capabilities and professional services available.
Each tool has unique strengths, from Datadog's ease of use to Zabbix's scalability. Choose based on your infrastructure's complexity, budget, and your team's expertise.
Quick Comparison:
| Tool | Deployment Model | Starting Price | Key Features | Support |
|---|---|---|---|---|
| Datadog | SaaS | $15/host/month | Unified monitoring, AI insights | 24/7 support |
| Dynatrace | SaaS/Hybrid | $0.04/hour/host | AI-powered, automatic discovery | Enterprise support |
| Prometheus + Grafana | On-premises | Free | Customizable, open-source | Community support |
| ManageEngine OpManager | On-premises | $95 (one-time) | Agentless, network-focused | Professional support |
| Zabbix | On-premises | Free | Scalable, enterprise-grade | Community/professional |
Choosing a tool that aligns with your operational needs and budget can help you maintain uptime, improve performance, and meet compliance requirements.
Top 20 Best Open Source Monitoring Tools for Servers, Networks & Apps
How to Choose the Right Monitoring Tools
Picking the right monitoring tool for your on-premises infrastructure isn’t just about ticking off a list of features - it’s about finding a solution that aligns with your organization’s unique needs and can adapt as your business grows. With nearly 40% of organizations juggling between 11 to 30 monitoring tools for applications, infrastructure, and cloud environments, making the right choice is crucial to avoid tool sprawl and unnecessary complexity.
Real-time analytics play a key role in spotting issues early and resolving them faster. At the same time, scalability ensures your monitoring system can handle the demands of enterprise operations and heavy workloads. But beyond these basics, there are three core areas that can make or break your monitoring strategy.
Performance and Scalability
Your monitoring tool must be able to grow with your business, handling enterprise-level workloads without breaking a sweat.
Start by defining baseline performance metrics and KPIs for your infrastructure during normal operations. This helps you measure how well a tool meets your needs. Look for features like analytics, customizable dashboards, and real-time alerts to get accurate insights without overwhelming your team with unnecessary data.
The type of monitoring approach you choose also matters. Agent-based monitoring provides more detailed data but consumes more resources, while agentless monitoring is lighter but offers less granular insights. Evaluate your infrastructure’s capacity and decide how much detail you need before choosing.
Alerting is another critical factor. Set up targeted alerts that prompt immediate action. Too many false alarms can lead to alert fatigue, while too few could mean missing critical issues. The key is to strike a balance where your team is alerted only to actionable problems.
Integration Capabilities
After ensuring strong performance, focus on how well the tool integrates with your existing systems. A monitoring tool that works seamlessly with your current setup ensures all IT components operate in sync, improving overall efficiency and reducing conflicts.
For organizations using enterprise platforms like Sitecore, Adobe Experience Manager, or SharePoint, integration is especially important. Your monitoring tool should provide end-to-end visibility across your technology stack without creating blind spots.
In DevOps environments, integration with CI/CD pipelines is a game-changer. It allows for early issue detection, tracks the impact of changes, prevents regressions, and even supports automated rollbacks when needed. This kind of feedback is essential for teams working with rapid deployment cycles.
When tools don’t communicate effectively, troubleshooting becomes fragmented, and mean time to resolution (MTTR) increases. Integration with incident management platforms like PagerDuty or Slack can significantly reduce metrics like mean time to detect (MTTD) and MTTR by speeding up escalation and resolution processes.
Support and Documentation
Even a top-tier monitoring tool is only as good as your team’s ability to use it effectively. That’s why robust customer support and thorough documentation are non-negotiable.
Look for vendors that offer 24/7 support and dedicated training resources. High-quality documentation should include technical details, step-by-step guides, and practical use cases to help your team get the most out of the tool.
Evaluate the vendor’s support model carefully. For organizations managing critical infrastructure, round-the-clock support is essential. Check response times, escalation procedures, and whether dedicated support teams are available.
Finally, consider the total cost of ownership, including setup and ongoing expenses. Factor in potential ROI from avoiding compliance penalties or operational downtime. Don’t forget to include training costs, support contracts, and the time needed to fully integrate the tool into your workflows.
A well-chosen monitoring tool should simplify your team’s work, enabling them to focus on proactive monitoring and optimization rather than wrestling with the tool itself. With performance, integration, and support in place, the next section will explore some of the top monitoring solutions available.
Best On-Premises Infrastructure Monitoring Tools
Now that you know what to look for in a monitoring solution, let’s dive into five standout tools designed to keep your on-premises infrastructure running smoothly. Each one brings its own strengths to the table, catering to different needs and technical setups.
Datadog
Datadog simplifies monitoring by offering a unified view of on-premises, hybrid, and cloud environments. With over 800 predefined integrations, it’s a go-to choice for organizations managing complex, multi-platform systems.
One standout feature is its easy deployment. As a fully SaaS-based tool, Datadog eliminates the hassle of on-premises installations while still delivering powerful monitoring capabilities. Plus, it offers a 14-day free trial, giving teams the chance to explore its features before committing.
For businesses running virtualized systems, Datadog’s integrations with IBM WebSphere and VMware vSphere provide detailed insights into application performance. Additionally, its Unix-native Agent supports critical metrics for IBM AIX systems. To cut down on unnecessary alerts, Datadog uses machine learning filters. Eric Saam, VP of Engineering at Business Insider, highlights its impact:
"Datadog's unified DevSecOps approach has improved our ability to manage risks, prioritize responses, and remediate issues. As a result, we've been able to reduce tool sprawl and foster a culture of shared security ownership throughout the organization."
If AI-driven insights pique your interest, you’ll want to check out the next tool.
Dynatrace
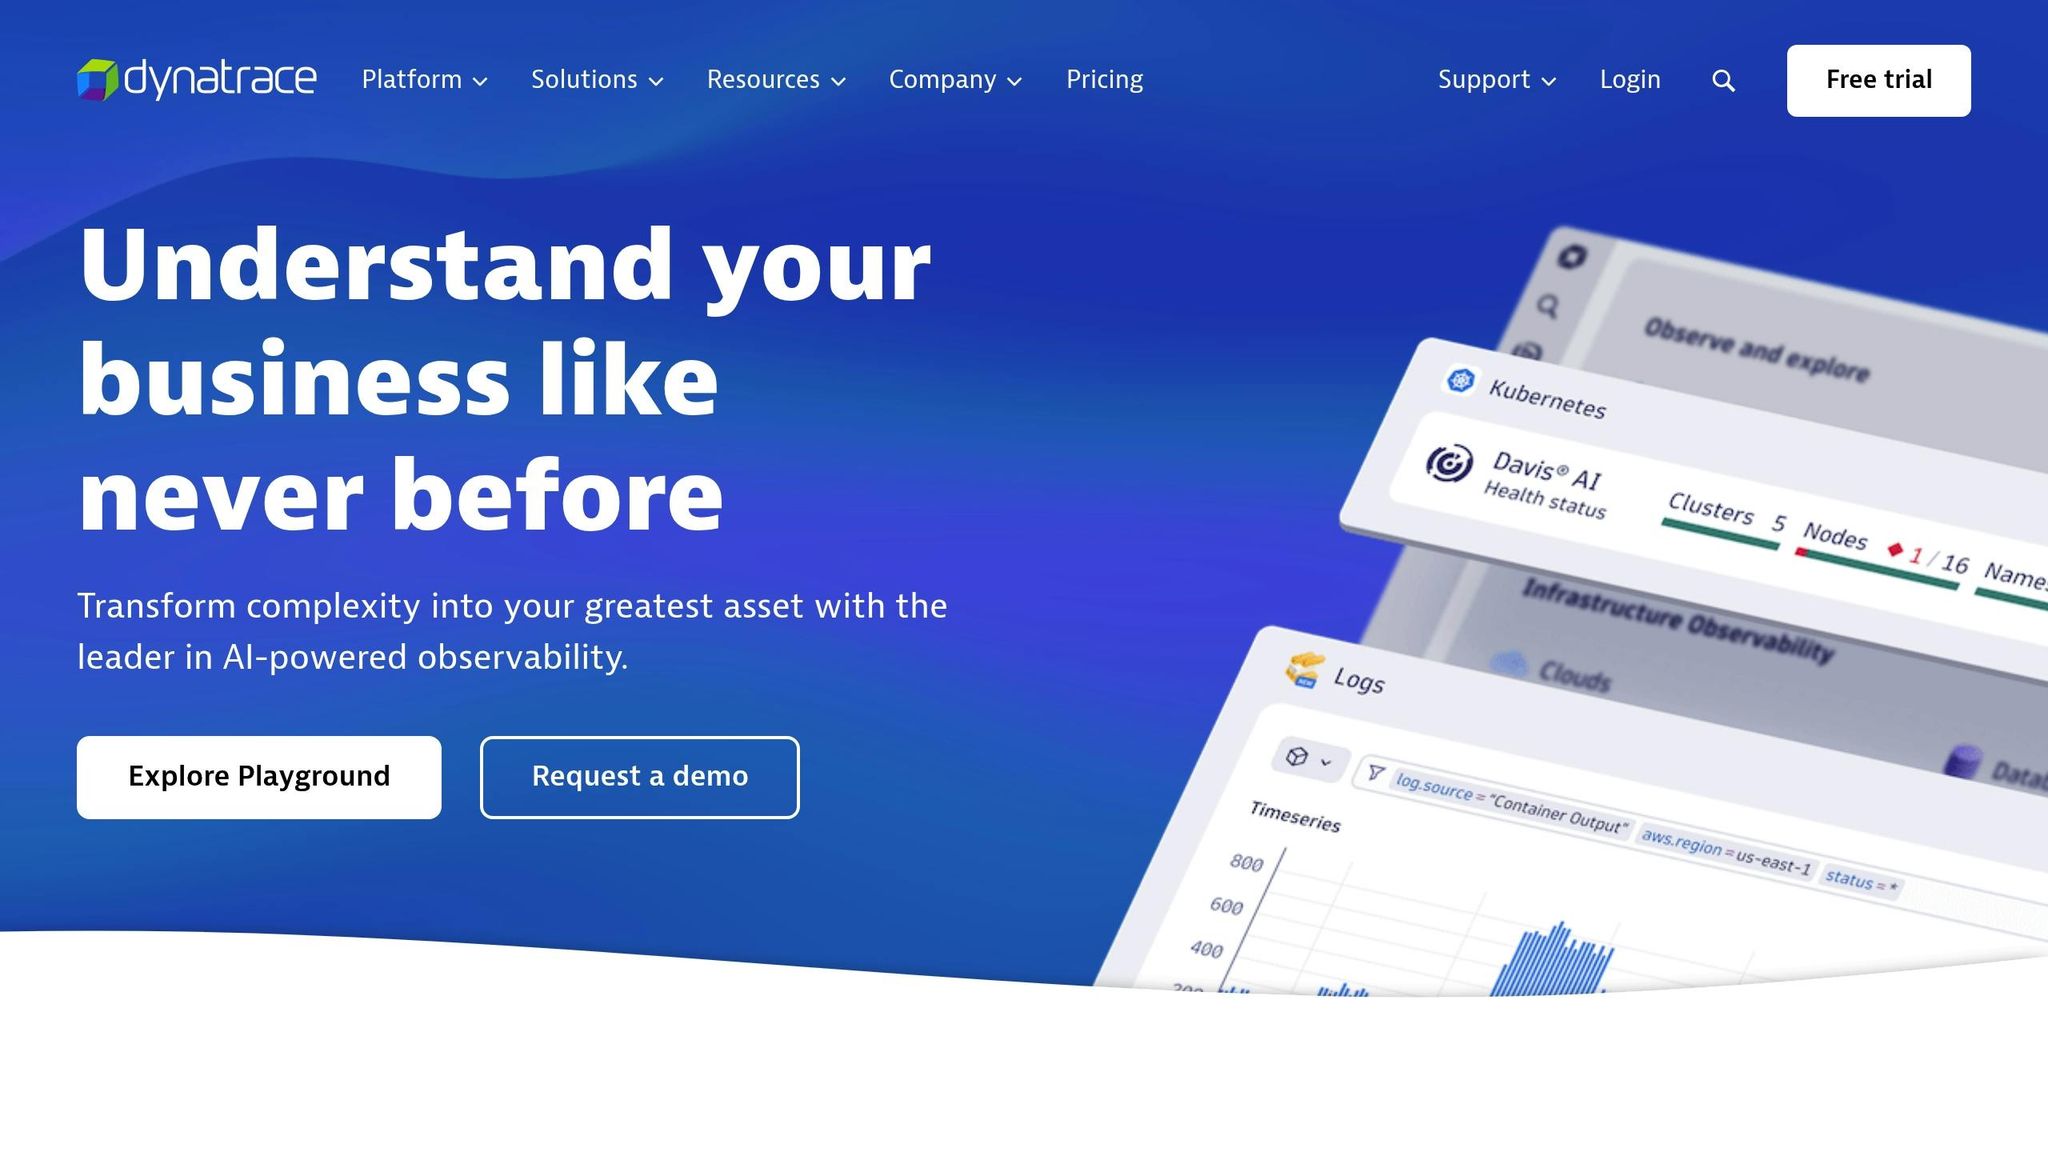
Dynatrace leverages AI to deliver powerful monitoring for on-premises setups, making it ideal for dynamic environments. Its automated deployment and AI-driven analytics help teams catch and address issues before they affect users. Designed for multi-cloud and hybrid systems, Dynatrace’s AI engine maps application dependencies and topologies automatically, cutting down on the manual work typically required to maintain monitoring configurations.
For those seeking open-source options, there are excellent alternatives to consider.
Prometheus and Grafana
The Prometheus and Grafana combo offers a budget-friendly, open-source solution for teams with technical know-how. Prometheus handles data collection and storage, while Grafana provides advanced visualization tools. Together, they deliver enterprise-level monitoring without hefty licensing fees.
However, this flexibility comes with some challenges. Prometheus requires more setup and expertise than commercial tools, and scaling infrastructure demands manual sharding, which can become tricky as systems grow. Despite these hurdles, for teams with strong DevOps skills, this pairing offers significant cost savings and adaptability.
ManageEngine OpManager
ManageEngine OpManager focuses on simplicity while delivering robust monitoring for networks, servers, and devices. It offers a free version for up to three devices and a 30-day free trial for larger deployments. Pricing starts at $245 and scales based on deployment size.
OpManager’s agentless design reduces overhead while providing detailed insights. Its OpManager Plus module expands functionality to cover physical and virtual infrastructure monitoring, bandwidth tracking, and log and IP monitoring - all through a single, integrated dashboard. Hinduja Global Solutions reported saving $3 million annually with the platform. Recognized in the 2025 Gartner Market Guide for Infrastructure Monitoring Tools and awarded spots like the Capterra Shortlist 2023 for Network Monitoring Software, OpManager has earned positive reviews. That said, some users mention occasional support inconsistencies and the need for fine-tuning in complex setups.
Zabbix
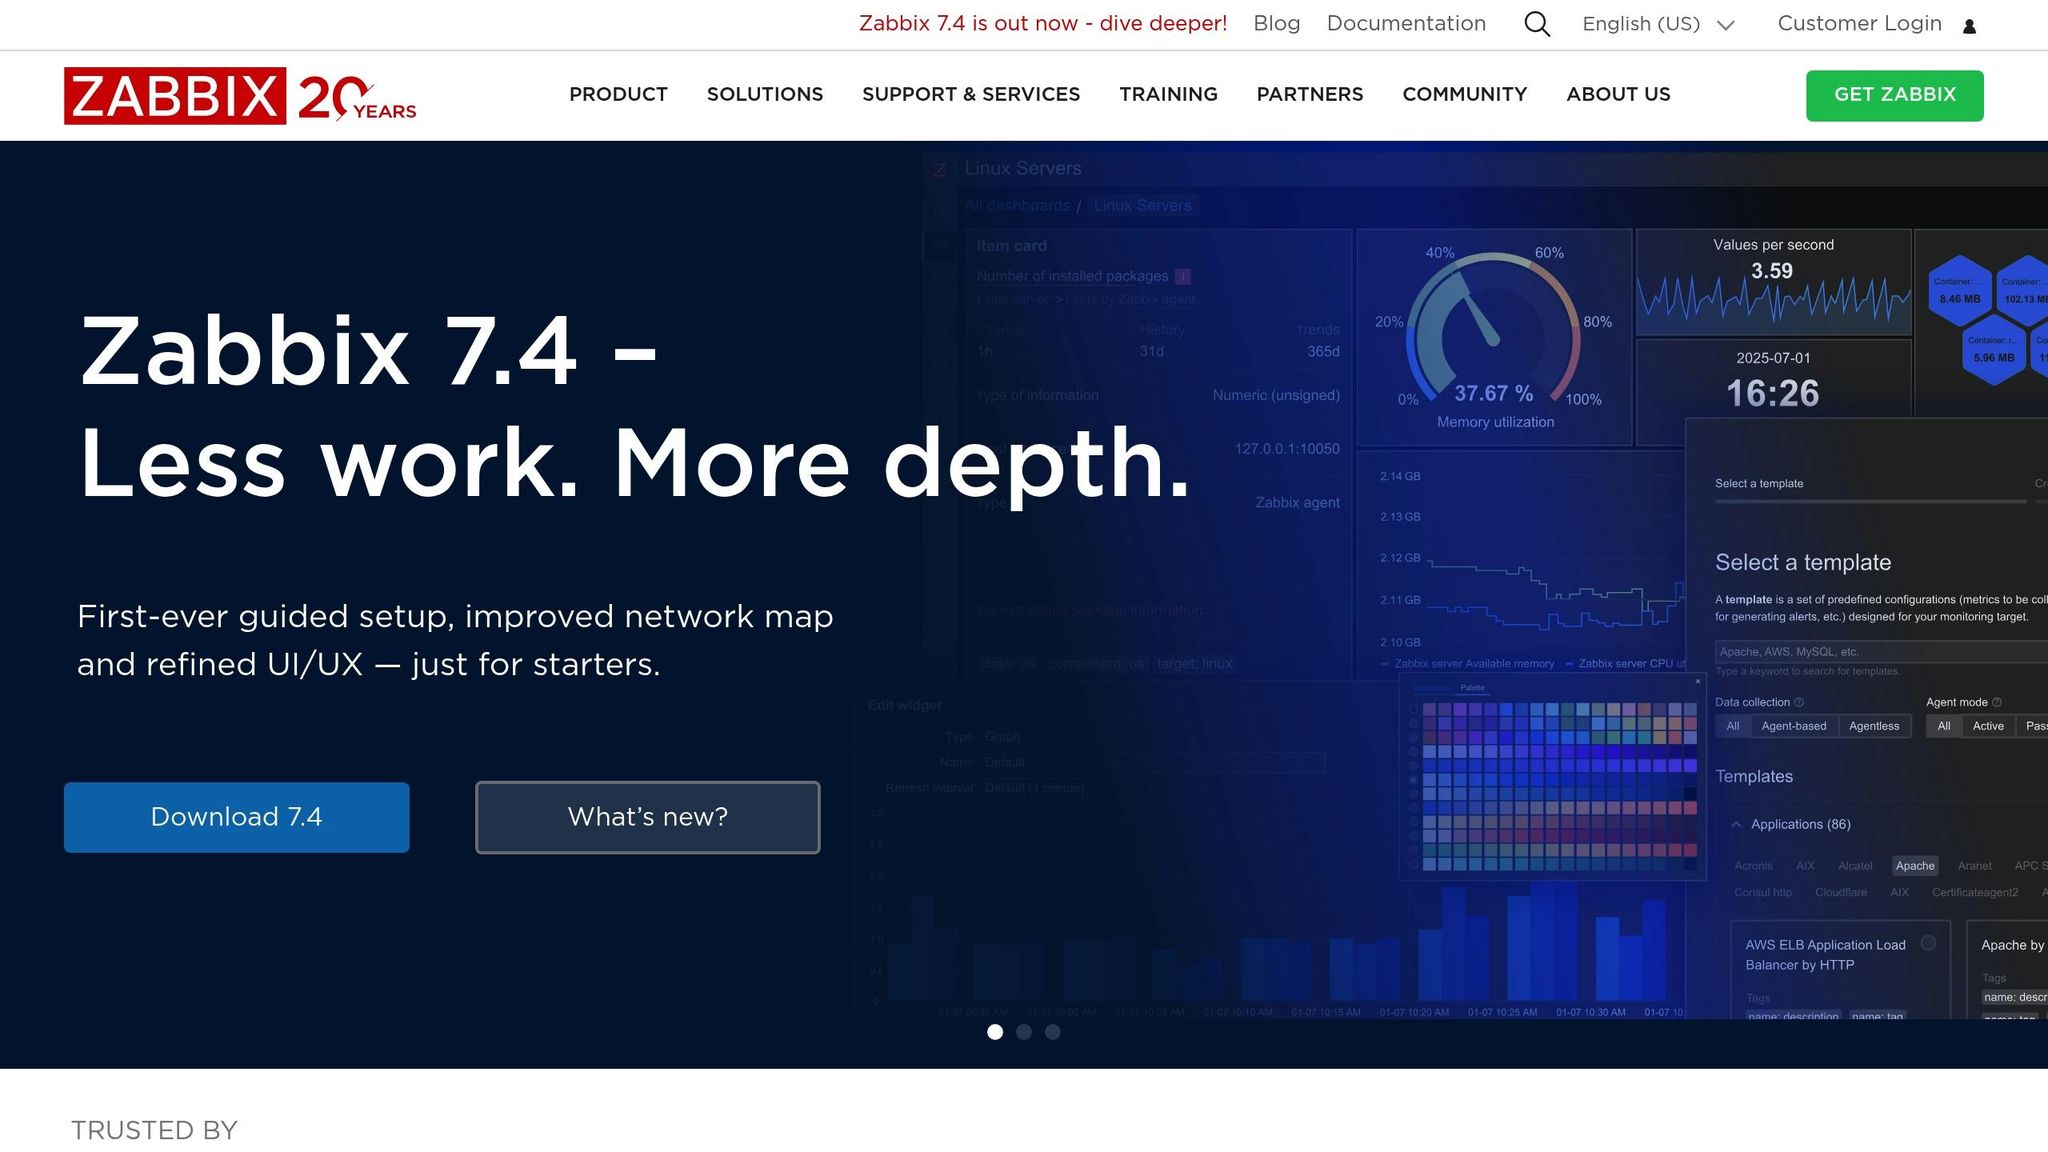
Zabbix offers enterprise-grade, open-source monitoring with impressive scalability. Some installations handle over 100,000 devices and process more than 3 million checks per minute. It supports both agent-based and agentless monitoring and uses a proxy system to scale from small offices to massive enterprise environments.
Its API makes integration with other enterprise tools seamless, while its open-source nature ensures transparency and security. Zabbix consistently earns high marks, with one review showing a 4.6 out of 5 rating from 327 users. For those needing extra support, Zabbix also provides professional services while retaining the benefits of an open-source foundation.
Each of these tools serves unique needs. The best choice depends on your infrastructure’s complexity, your team’s expertise, and your budget. Matching the tool to your requirements is the key to effective monitoring.
sbb-itb-91124b2
Tool Comparison
The table below provides a side-by-side comparison of five popular monitoring tools for on-premises infrastructure, highlighting their deployment models, pricing, strengths, integration capabilities, and support options.
| Tool | Deployment Model | Starting Price (USD) | Core Strengths | Integration Support | Support Options |
|---|---|---|---|---|---|
| Datadog | SaaS | $15/host/month (Pro) | Unified observability, 900+ vendor-backed integrations, AI-driven insights | 900+ vendor-backed integrations | 24/7 support, extensive documentation |
| Dynatrace | SaaS/Hybrid | $0.04/hour/host (Infrastructure) | AI-powered anomaly detection, automatic discovery, full-stack observability | Cloud and container native monitoring | Enterprise support, automated configuration |
| Prometheus + Grafana | On-premises/Self-hosted | Free (open-source) | Time-series data collection, powerful query language (PromQL), full customization | Easy Grafana integration, extensive community plugins | Community support; Grafana Cloud from $19/month |
| ManageEngine OpManager | On-premises/Cloud | $95 (one-time) | Agentless monitoring, device-based licensing, network focus | SNMP, WMI, SSH protocols | Professional support |
| Zabbix | On-premises/Cloud | Free (open-source) | Enterprise-grade monitoring capabilities | Multiple protocols (SNMP, IPMI, JMX, HTTP, SSH), auto-discovery | Community support and professional services; Zabbix Cloud from $50/month |
Dynatrace uses an hourly pricing model at $0.04 per host, translating to approximately $29 per month per host for continuous monitoring. Meanwhile, Prometheus + Grafana stands out as a cost-free option, but you’ll need to account for hosting expenses and the technical expertise required for setup and maintenance. ManageEngine OpManager, with its one-time fee of $95, is particularly attractive for smaller-scale deployments, while Zabbix offers enterprise-grade monitoring without licensing costs.
Datadog simplifies operations with over 900 vendor-backed integrations, reducing the need for manual setup and speeding up implementation. Similarly, Dynatrace focuses on automatic discovery and AI-driven analysis to minimize manual configuration, which can significantly enhance operational efficiency.
However, deployment complexity varies across tools. Open-source solutions like Prometheus + Grafana often require substantial initial effort to scale, ensure high availability, and manage storage. In contrast, SaaS tools like Datadog and Dynatrace handle scalability automatically, making them easier to manage as environments grow.
When it comes to scalability, Zabbix is built to handle large-scale deployments. On the other hand, Prometheus may need manual sharding as your infrastructure expands, which can become challenging for larger systems.
Support options also differ significantly. Open-source tools like Zabbix and Prometheus rely heavily on community support, though professional services are available. Meanwhile, commercial tools such as Datadog, Dynatrace, and ManageEngine OpManager provide dedicated support teams and detailed documentation.
Ultimately, the choice of tool depends on balancing ease of use, cost, and control. SaaS platforms like Datadog and Dynatrace reduce operational overhead but come with recurring subscription fees. In contrast, open-source solutions like Zabbix and Prometheus offer more flexibility and cost savings but demand technical expertise and in-house resources.
Conclusion
Selecting the right monitoring solution is crucial for maintaining smooth operations and avoiding costly disruptions. With downtime averaging a staggering $300,000 per hour, proactive monitoring isn't just a technical measure - it's a financial and operational necessity. Beyond the financial impact, downtime erodes trust and complicates compliance, making a solid monitoring strategy essential.
The tools explored - Datadog, Dynatrace, Prometheus with Grafana, ManageEngine OpManager, and Zabbix - each offer distinct strengths tailored to different organizational needs. Whether your focus is on seamless integrations, real-time insights, affordability, or enterprise-level scalability, these tools provide a strong foundation for managing infrastructure effectively.
"A major goal of employing a monitoring tool is to recognize a problem and hopefully get it fixed before the users become aware of it." - Kelly C. Bourne
The importance of real-time analytics and integrations cannot be overstated. A 2024 study found that businesses leveraging real-time data achieved 97% higher profit margins and 62% greater revenue growth compared to their competitors. This stark contrast highlights how monitoring has shifted from being a technical task to a strategic business advantage.
To choose the right tool, start by evaluating your specific needs. Consider your current technology stack, scalability demands, budget, and the expertise of your team. Nearly half of all downtime incidents stem from issues within the application or infrastructure itself, making early detection capabilities a must. Establish performance baselines and set clear alert protocols to protect operations and support growth.
Security is another critical consideration. With 32% of enterprise infrastructure containing vulnerabilities actively targeted by hackers, your monitoring solution should not only track performance but also strengthen your security and compliance efforts. For instance, the Bank of New Zealand saw a 94% reduction in major service incidents and a 58% boost in quality releases after implementing a rigorous monitoring system. This illustrates how the right strategy can transform operations.
Take the time to thoroughly assess your organization's needs, test potential solutions in your environment, and select a tool that aligns with both your technical and business goals. A well-chosen monitoring system ensures better uptime, optimal performance, and the proactive issue resolution needed to stay ahead in a competitive landscape.
FAQs
How can I choose the right on-premises infrastructure monitoring tool for my organization?
To pick the best on-premises infrastructure monitoring tool for your organization, start by pinpointing your specific requirements. Think about what needs monitoring - whether it's hardware, software, or network components. Also, consider the tool's ability to handle future growth and how well it can integrate with your current systems.
You'll also want to weigh factors like budget, security protocols, and compliance standards to ensure the tool fits within your operational framework. Don’t overlook usability - make sure the tool is straightforward enough for your IT team to implement and manage without straining resources. Keeping these priorities in mind will help you choose a solution that supports your infrastructure and keeps everything running smoothly.
What’s the difference between agent-based and agentless monitoring, and how do they affect system performance and resource usage?
Agent-based monitoring involves installing software directly onto devices to collect data. This method delivers in-depth insights and strong monitoring capabilities. However, it does come with a trade-off: it can increase the use of system resources like CPU, memory, and storage, which might impact overall performance.
Agentless monitoring takes a different approach. It collects data using network protocols and APIs, avoiding the need for software installation on individual devices. This makes it a more lightweight option with minimal impact on system resources. That said, it often relies heavily on network connectivity and may not provide the same level of detailed data as agent-based monitoring.
Deciding between the two approaches depends on your specific needs. If your priority is detailed, granular data, agent-based monitoring might be the better fit. On the other hand, if conserving system resources is more important, agentless monitoring could be the way to go.
Why are integration capabilities important when choosing a monitoring tool, and how can you ensure it works seamlessly with your existing systems?
Integration capabilities play a key role when choosing a monitoring tool. They allow different systems to communicate effortlessly, ensuring a steady flow of data and smooth operations. A tool that integrates well can provide real-time insights, speed up issue resolution, and improve system reliability - critical for keeping on-premises infrastructure running at its best.
When evaluating a tool, check if it works well with your existing systems, supports straightforward data sharing, and includes automation features. Focusing on these aspects can help you avoid unnecessary disruptions and get the most out of your monitoring setup.


