

A customer journey mapping template isn't just a document; it's a visual framework that helps you see your business through your customers' eyes. It charts out every single interaction they have with you, from the moment they first hear your name to the loyalty they show long after a purchase. Think of it as a roadmap for identifying pain points and uncovering opportunities to create better, more engaging experiences.
Why Customer Journey Maps Are Essential

Before you jump into a template, it’s worth understanding why this tool is so much more than a flowchart. A well-crafted customer journey map is a strategic compass. It guides your teams through the twisting, turning path your customers actually take—not the one you think they take.
More importantly, it’s the key to breaking down the internal silos that often pop up between marketing, sales, and service. Without a single, unified view of the customer's world, these teams are essentially operating with blinders on. Marketing might be celebrating a killer lead generation campaign, completely unaware that those same leads are hitting a wall of friction during the sales handoff.
A customer journey map brings these hidden disconnects into the light. It also highlights those "moments of magic" that turn a one-time buyer into a lifelong advocate.
From Guesswork to Data-Driven Decisions
In complex B2B sales cycles, relying on assumptions is a recipe for disaster. This is where a journey map built with rich, unified data becomes your single source of truth.
For instance, by feeding data from a tool like Sitecore CDP (Customer Data Platform) directly into your map, you graduate from guesswork to precise, data-backed insights. You’re no longer just looking at the idealized sales funnel you designed. Instead, you can see the actual, non-linear paths customers take.
You can pinpoint exactly where a high-value prospect dropped off after viewing certain content or identify the specific touchpoint that re-engaged a dormant account. This is the bedrock of creating truly personalized experiences that connect with what individual customers need, right when they need it.
Think of a customer journey map not as a static document, but as the blueprint for a complete customer-first transformation. It’s a living tool that should evolve right alongside your customers and your business.
The Growing Importance of Journey Mapping
The business world is catching on—fast. The market for customer journey mapping software was valued at USD 16.8 billion in 2025, but it's projected to skyrocket to USD 76.2 billion by 2035.
This explosive growth signals a massive shift in business priorities. Enterprises everywhere are investing heavily to visualize and analyze every touchpoint, all in the name of better customer engagement.
Ultimately, a customer journey map is the cornerstone of a customer-centric culture. It aligns your entire organization around a shared understanding of the customer's reality, fostering empathy and driving improvements that actually matter. But to truly succeed, this map must inform a broader strategy. That's why it's so important to explore the key steps of a customer-centric digital transformation. Doing so ensures your mapping efforts translate directly into measurable business outcomes and superior customer experiences.
Gathering the Right Data for Your Map
A powerful customer journey map runs on high-quality data, not just assumptions. Before you can even think about filling out a template, you need a solid foundation of both quantitative and qualitative insights. It's about blending the hard numbers with the human story to build a map that actually reflects reality.
Quantitative data tells you what is happening. This is where a platform like Sitecore really shines. Dive into Sitecore Analytics to see how users are moving through your site, identify the content that grabs their attention, and pinpoint exactly where they're dropping off in your funnels. This behavioral data forms the skeleton of your map—the real steps people are taking.
But analytics alone can't tell you the why. For that, you need to get personal.
Weaving in the Human Element
Qualitative insights add the emotional layer that brings your map to life. This is the stuff numbers just can't capture: your customer's thoughts, feelings, and motivations. The only way to get it is to go straight to the source.
Here are my go-to sources for this kind of information:
- Customer Surveys: Use targeted surveys at specific touchpoints to ask direct questions about their experience. Keep it short and to the point.
- Support Tickets: Your support team's inbox is a goldmine. Analyze those conversations to find recurring pain points and frustrations.
- Social Listening: Keep an eye on social media to understand what people are saying about you when they think you're not looking. This is where you get the unfiltered truth.
- Stakeholder Interviews: Don't forget your internal teams! Talk to sales, marketing, and customer service. They’re on the front lines every day and have invaluable firsthand knowledge.
To really nail this, you’ll want to explore various customer feedback collection tools that can help you streamline the whole process and get a deeper understanding of your audience.
Centralizing Your Research for Collaboration
As all this data starts rolling in, things can get messy fast. A scattered collection of spreadsheets, documents, and analytics reports is a recipe for confusion. This is where a collaborative platform like SharePoint becomes an absolute game-changer.
Create a dedicated SharePoint site to act as a central hub for all your journey mapping research. This creates a single source of truth for your entire team, ensuring everyone is working from the same information.
Use a SharePoint document library to store everything—interview transcripts, survey results, analytics reports. You can even create lists to track key pain points and opportunities as you uncover them. It keeps you organized and makes it so much easier to integrate all the different pieces of the puzzle. For a deeper dive, our guide on customer data integration solutions offers some more advanced strategies.
When you combine the powerful analytics from Sitecore with organized qualitative feedback in SharePoint, you create a holistic, data-rich view of the entire customer experience. That's what separates a pretty flowchart from a strategic tool that actually drives business results.
How to Use Our Journey Mapping Template
Alright, let's get our hands dirty and put this customer journey mapping template to work. Think of it less like a spreadsheet you have to fill out and more like a canvas. This is where all that rich data from your Sitecore ecosystem starts to tell a story—a visual one about your customer's real experience.
This infographic breaks down the core journey stages we’ll be mapping. It’s a great visual starting point.
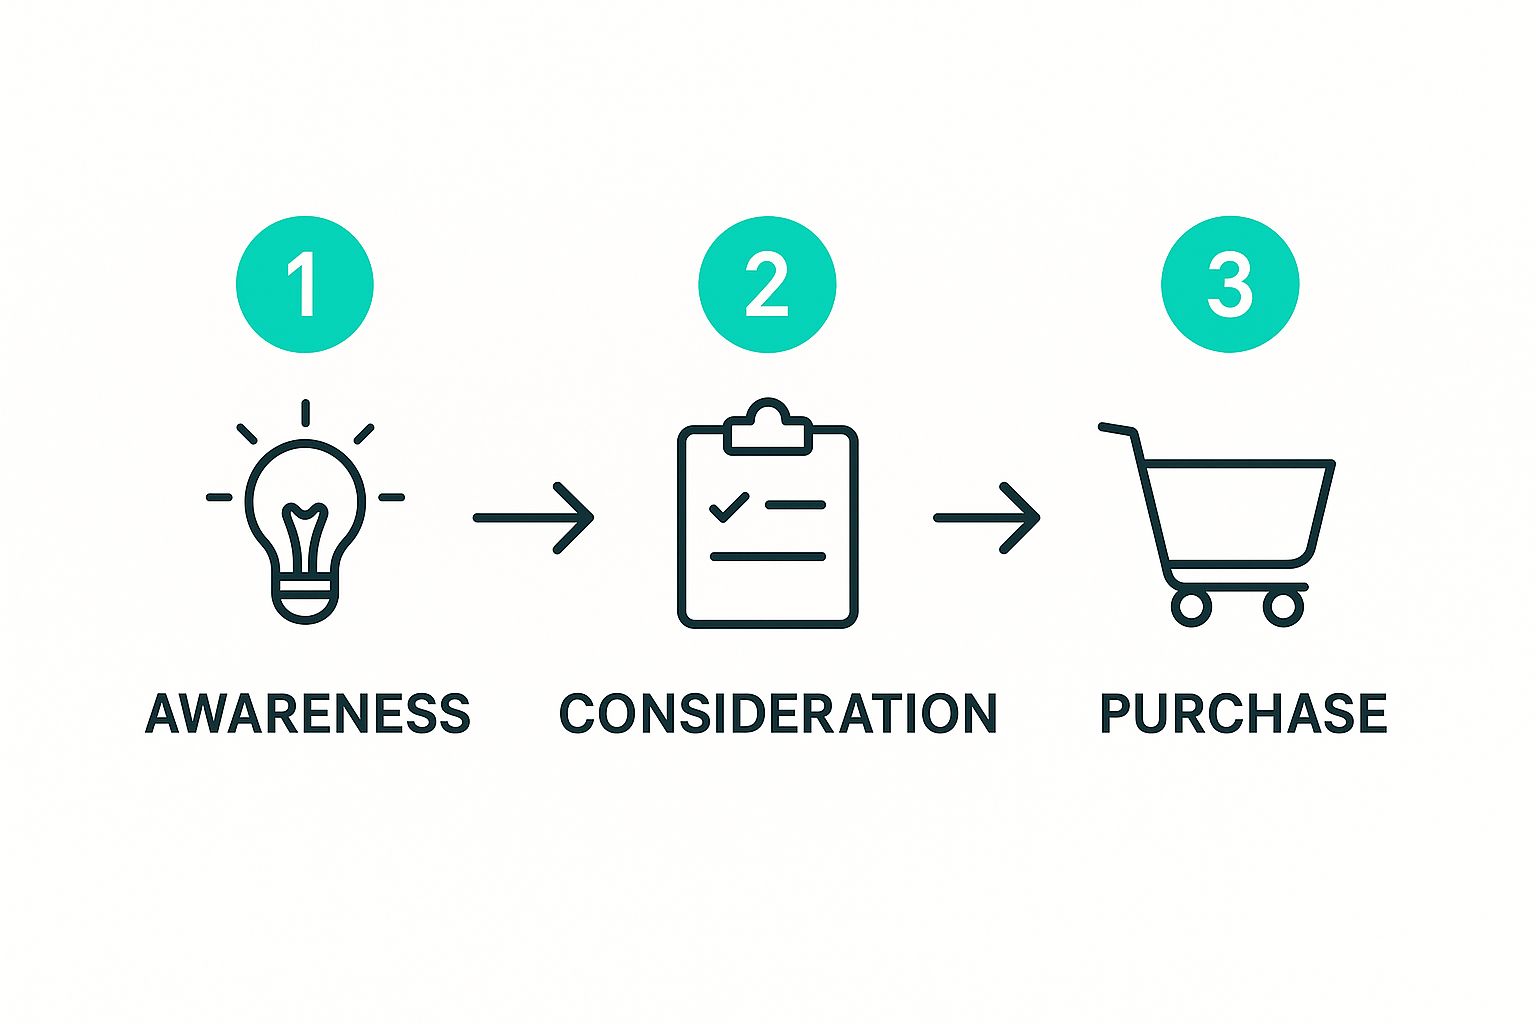
You can see how a customer's goals and interactions shift as they move from just becoming aware of a problem to seriously weighing their options, and finally, making a decision. Your map’s job is to fill in the crucial details of those transitions.
Breaking Down the Template: What Each Lane Means
Our template is laid out in horizontal lanes, and for good reason. Each one captures a different layer of the customer experience. This structure forces you to build a complete picture, not just a simple timeline of events.
Here are the key rows you’ll be working with:
- Stages: These are the big-picture phases of the journey—think Awareness, Consideration, and Purchase. This is the backbone of your map.
- Goals: What is the customer actually trying to do at this stage? It's critical to frame this from their point of view, not your business objectives.
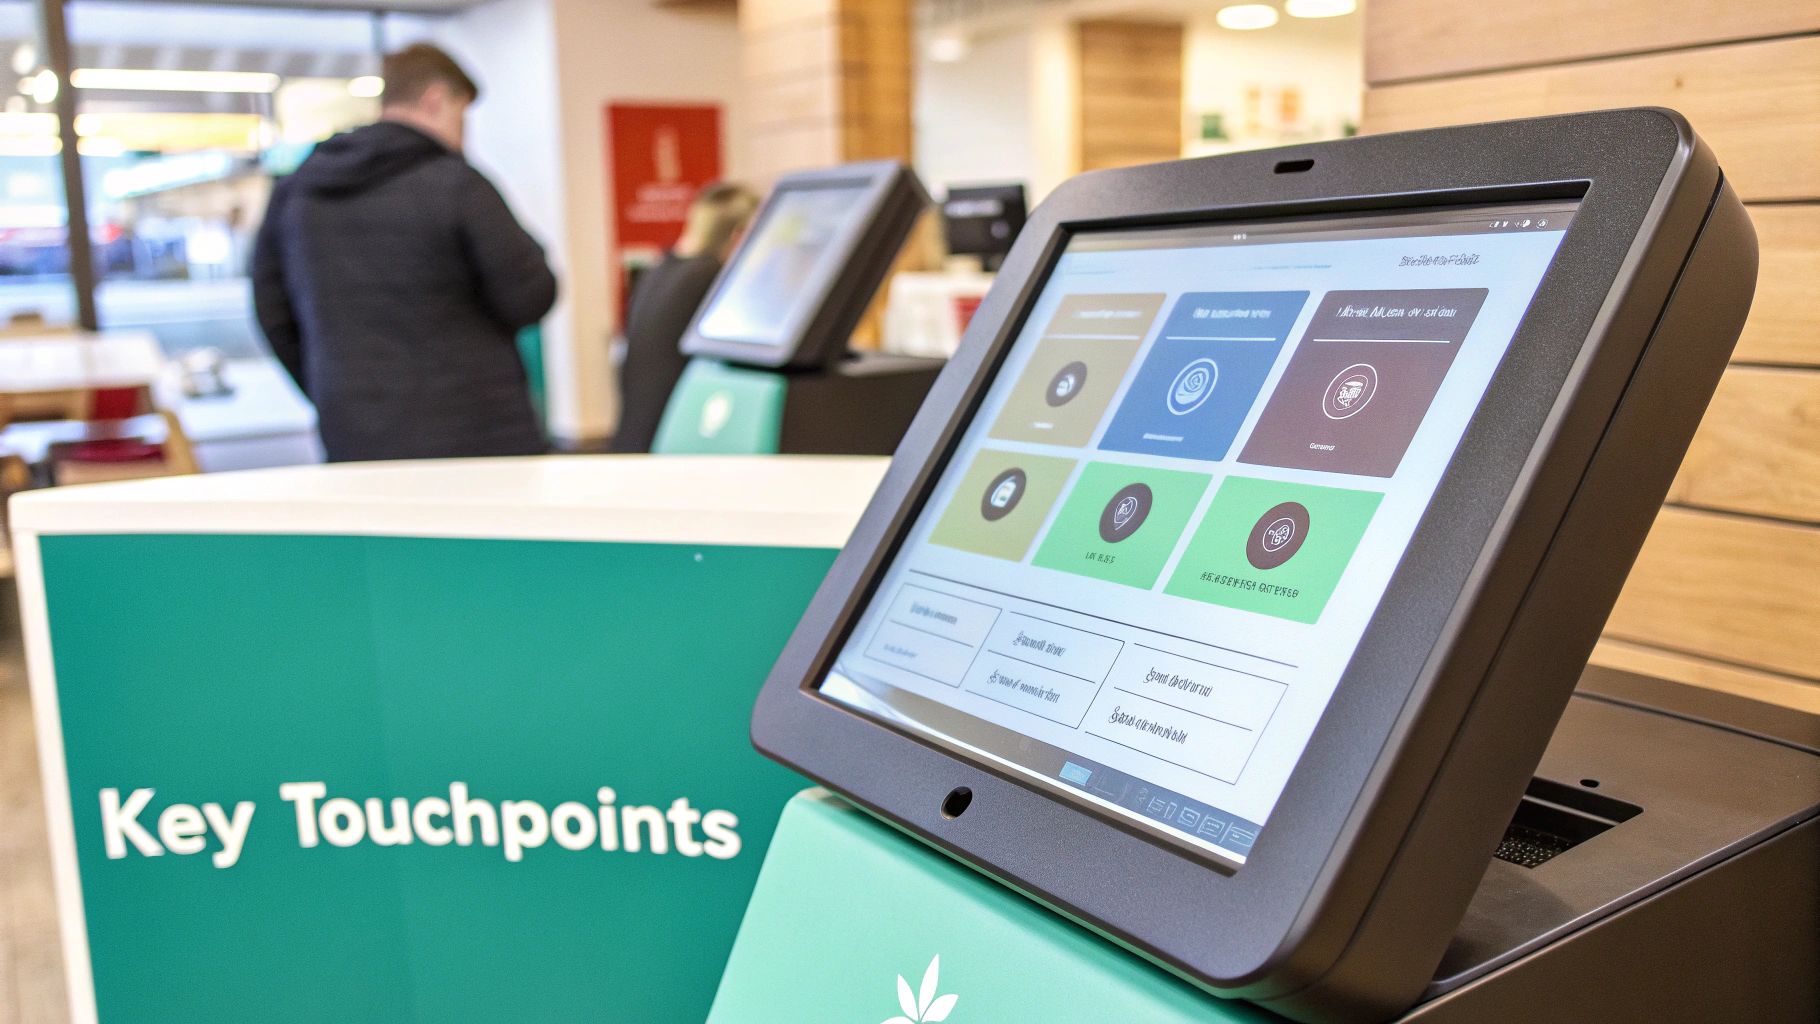
- Touchpoints: This is where they interact with you. Don't just write "website" or "email." Get specific. Was it a dynamic component on a landing page served up by Sitecore Personalize? Or an automated email from a marketing flow they triggered?
- Actions: What are the specific things they're doing? This could be anything from downloading a whitepaper to using a product configurator.
- Emotions: How are they feeling? Simple, direct words work best here: "frustrated," "confident," "confused," "relieved."
Before we dive deeper, it's helpful to see these stages laid out. Here’s a quick table outlining what each stage typically involves.
Key Stages of a Customer Journey Map
This table outlines the typical stages in a customer journey, detailing the customer's primary goal and common business touchpoints for each phase.
This structure gives you a solid framework to build upon as you start adding your own specific data and insights.
Turning Sitecore CDP Data into Actionable Insights
This is where the real value comes in. The last two rows of the template—Pain Points and Opportunities—are where you stop just listing data and start shaping strategy. You aren't guessing; you're pulling insights directly from your platform.
Let's say your Sitecore CDP shows a clear pattern: a high-value customer segment consistently drops off after visiting a specific technical documentation page.
A pain point isn't just a minor annoyance. It's a measurable moment of friction where you're losing business value. When you can pinpoint these with data from Sitecore CDP, you know exactly what to fix first.
Back in your template, the pain point might be: "Technical documentation is confusing for non-expert users." The corresponding opportunity becomes immediately clear: "Create a summary video or an interactive guide using Sitecore Content Hub to simplify the information and plug that leak." See how that works?
Keeping Everyone on the Same Page with SharePoint
As your team starts adding their insights, things can get messy fast. Using a shared Excel file on SharePoint is the perfect way to keep a single source of truth. It allows multiple people to contribute their expertise at the same time without creating a nightmare of different file versions.
Just imagine: your marketing lead is plugging in touchpoint data from a recent campaign while a sales manager is adding direct customer feedback from their latest calls. This kind of real-time collaboration transforms your customer journey map from a static report into a living, breathing document. It becomes the unified view of your customer—powered by Sitecore and organized seamlessly in SharePoint.
Using AI for Predictive Journey Insights

A traditional customer journey map is a fantastic tool for looking backward. It tells you the story of what already happened. But what if your map could tell you what’s likely to happen next? That’s where artificial intelligence comes in, transforming the entire exercise from reactive analysis to proactive strategy.
This is exactly what platforms like Sitecore CDP are designed to do. By unleashing machine learning on the mountains of data you're already collecting, your static journey map evolves into a living, breathing tool for growth. It stops being just a diagram and becomes a predictive engine.
Uncovering Patterns with Machine Learning
The real magic of AI here is its ability to spot patterns that are invisible to the human eye. Sitecore's machine learning models can comb through millions of customer interactions, finding tiny correlations between certain actions, the content they consumed, and what they eventually did. This is how you turn raw data into something you can actually act on.
For instance, an AI model might find that customers who watch a specific product demo video and then visit your pricing page twice are 85% more likely to buy. Armed with that knowledge, you can get ahead of the game. Using a tool like Sitecore Personalize, you could automatically trigger a tailored offer the second time they land on that page. You’re no longer just observing their journey; you’re shaping it.
This integration of AI is completely changing how we understand customer pathways. It's worth exploring some game-changing AI sales tools that can sharpen these predictive insights even further.
Practical AI Use Cases in Journey Mapping
Let's get out of the clouds and talk about how this actually works. AI isn't just some abstract concept; it's a set of real tools that make your journey map smarter and more effective.
Here are a few ways this plays out:
- Automated Segmentation: Instead of manually bucketing customers by simple demographics, Sitecore’s AI can group them by behavior. It might identify a segment of "hesitant researchers" or "decisive buyers," letting you craft different experiences for each group's unique path.
- Predictive Churn Scores: The AI can analyze behavior to flag customers who are at risk of leaving. If someone's churn score suddenly jumps, you can step in with a retention campaign before they've decided to walk away.
- Next-Best-Action Suggestions: This is where generative AI shines. Based on what a customer is doing right now, the system can recommend the perfect next step to guide them along—whether that's suggesting a blog post or prompting a sales call.
This shift toward AI-powered personalization is a huge deal. The global customer journey analytics market, valued around USD 20.87 billion in 2025, is projected to more than double by 2030, with AI being the primary engine for that growth.
Ultimately, AI allows you to move from mapping what was to predicting what will be. It's about seeing the future in your data and acting on it before your competitors do.
By understanding how AI analyzes user behavior in real-time, you can really appreciate how these predictive models work their magic. This elevates your customer journey mapping template from a simple planning document into a strategic weapon for growth.
Turning Your Journey Map into an Action Plan
Getting your customer journey map done is a huge win, but it’s really just the starting point. A beautiful map that sits in a folder collecting digital dust is a massive missed opportunity. The real magic happens when you turn those hard-won insights into a strategic, measurable action plan.
The discoveries you’ve made are your new marching orders. It's time to shift from analysis to action, transforming those pain points and bright spots into tangible projects that genuinely improve the customer experience. This is where your map starts paying dividends for the business.
Prioritizing Your Opportunities
Your map probably uncovered dozens of potential improvements, and trying to tackle them all at once is a recipe for getting nowhere fast. What you need is a clear way to prioritize. A simple but incredibly effective tool for this is the impact versus effort matrix.
- High-Impact, Low-Effort: These are your quick wins. Jump on them immediately. Think of something like clarifying confusing copy on a key landing page—a change that might take a few hours but could give your conversion rates a serious boost.
- High-Impact, High-Effort: These are your big, strategic projects. They need careful planning and resources. Redesigning your entire checkout flow, for instance, is a major undertaking, but the payoff in revenue could be enormous.
- Low-Impact, Low-Effort: Squeeze these in when you have some spare capacity. They won’t be game-changers, but they’re still worth doing.
- Low-Impact, High-Effort: These go to the very bottom of the list. You can always revisit them later to see if circumstances have changed.
Activating Insights with Sitecore
Once you’ve got your priorities straight, it's time to put your tech stack to work. For example, if your map flagged a clunky, one-size-fits-all checkout process, that's a perfect candidate for personalization. With a tool like Sitecore Personalize, you could design and run A/B or multivariate tests on a new, streamlined flow for a specific customer segment.
Or maybe you found a big gap in how you engage customers after they buy something. That’s a clear signal to build out an automated email nurture series. You can set up triggers in Sitecore CDP based on customer behaviors to send timely, relevant content that builds loyalty and brings people back for more. For more ideas on creating seamless interactions, you can learn more about omnichannel marketing in our article.
The key is to assign ownership for every single action item. A task without an owner is a task that will never get done. Each prioritized opportunity needs a name and a deadline next to it.
Tracking Progress with SharePoint
Accountability is everything, and this is where a tool like SharePoint becomes incredibly useful. You can take your prioritized list of opportunities and turn it into a living, breathing project plan with a simple SharePoint List.
Just create columns for the task, the owner, the due date, and its current status. This gives everyone a transparent, centralized view of all the improvement initiatives. Leadership can see progress at a glance, and team members know exactly what’s on their plate. This closes the loop, proving the ROI of your journey mapping by directly connecting the map to completed projects and measurable results.
And the value of this work is only growing. The United States leads the customer journey analytics market, which is projected to expand to USD 83.6 billion by 2034. It's a clear sign that businesses are betting big on these data-driven action plans. Discover more insights about this rapidly expanding market on dimensionmarketresearch.com.
Your Top Journey Mapping Questions, Answered
Even with a solid customer journey mapping template in hand, you're going to have questions. That’s a good thing. This process is part science, part art, and getting it right means digging into the details. I’ve spent years helping organizations untangle their customer paths, so I've heard just about every question there is.
Let's clear up some of the most common points of confusion I see, drawing on my experience with platforms like the Sitecore ecosystem and collaboration tools like SharePoint.
How Often Should We Update Our Customer Journey Map?
Think of your map as a living document, not a one-and-done project you can file away. A full, deep-dive review should happen at least once a year. But the real key is to revisit it any time your business makes a significant change.
What counts as a significant change? A new product launch, a website overhaul, or a major shift in marketing strategy are all triggers. For example, if you spot a big swing in customer behavior within your Sitecore Analytics, that’s your cue to pull up the map. If you've just updated your customer support portal, you absolutely need to remap that service stage to find new friction points and opportunities.
A customer journey map that doesn't evolve with your business becomes a historical artifact, not a strategic tool. Regular updates are non-negotiable to keep it relevant and valuable.
What Is the Difference Between a Journey Map and a User Flow?
This one comes up a lot, and the distinction is all about perspective. A user flow is tactical and narrow. It’s focused on the specific, click-by-click steps a person takes to complete a single task—think checking out or filling out a form on your site. These are the kinds of things you can track directly within Sitecore.
A customer journey map, on the other hand, is strategic and incredibly broad. It paints the full picture of a customer's relationship with your brand, stretching across multiple touchpoints, channels, and a much longer period. It captures the critical elements that user flows miss, like offline interactions, the customer's motivations, and that all-important emotional layer. A user flow is just one small, technical piece of a much larger, more human journey map.
Should We Create Different Maps for Different Customer Segments?
Yes, absolutely. In fact, you have to. A one-size-fits-all map gives you one-size-fits-none insights—they’re just too generic to be useful. The journey an enterprise client takes to purchase a complex DXP solution is a world away from the path a small business customer follows.
Building out separate maps for your key personas is where the real magic happens, especially for personalization. You can use a tool like Sitecore CDP to define these distinct audiences based on their behavior, demographics, and value. From there, you map their unique paths, pain points, and opportunities. That’s where you’ll find your biggest wins.
How Does SharePoint Support the Journey Mapping Process?
SharePoint is the perfect collaboration hub for this kind of project; it can act as the central nervous system for your entire effort. We often set up a dedicated site to serve as the single source of truth for all the research—interview notes, survey data, analytics reports, you name it.
A document library is great for version control, ensuring everyone is always working on the latest iteration of the map. Even better, you can use a SharePoint List to create an actionable project plan right from your map's findings, assigning owners to different initiatives and tracking their progress. When you pair it with Microsoft Teams for workshops and discussions, it keeps the whole team aligned and makes the entire process incredibly smooth.
Ready to turn your customer insights into a real strategic advantage? Kogifi specializes in implementing and optimizing Digital Experience Platforms like Sitecore and SharePoint to create seamless, data-driven customer journeys. Let's build your blueprint for success together.