

Everyone knows the classic ROI formula: take your total revenue, subtract the total cost, divide that by the cost, and multiply by 100. It’s simple. A campaign that costs $20,000 and brings in $50,000 gives you a 150% ROI. Easy enough.
But when you're trying to apply that simple math to a powerhouse platform like a composable DXP, particularly a sophisticated ecosystem like Sitecore, things get complicated fast. The basic formula just doesn't cut it. To truly understand the return on a strategic investment like Sitecore, you need a much more robust framework.
Defining Your Sitecore ROI Framework

Before you can even begin to measure the ROI of your Sitecore investment, you have to move beyond that basic formula. The real work isn't in the calculation; it’s in accurately defining what "Cost of Investment" and "Net Profit" actually mean for your business when driven by Sitecore's capabilities.
A solid framework forces you to look at the complete financial story, not just the numbers that are easy to find. It’s about understanding how every single feature and function of the Sitecore stack—from Experience Platform to Content Hub to Sitecore Personalize—contributes to your bottom line, both directly and indirectly.
Unpacking the Total Cost of Investment
Figuring out the "cost" side of the ROI equation for Sitecore is about more than just the license fees. If you want an accurate baseline, you need to account for everything. Miss just one component, and you could seriously skew your final ROI, making the platform look far more or less profitable than it actually is.
To get the full picture, your cost analysis has to include:
- Platform Licensing: This is the foundational cost of using Sitecore's software. It can vary significantly depending on which products you're using, such as Sitecore XM Cloud, Sitecore Experience Platform (XP), Content Hub, or Sitecore Personalize.
- Implementation and Development: This bucket covers all the initial setup, customization, and integration work. Whether it’s done by a Sitecore partner or your in-house team, it's often one of the biggest upfront expenses.
- Team Training and Onboarding: Don't forget the resources you invest in getting your marketing and development teams up to speed on Sitecore's powerful but complex toolset. It's a critical, and often overlooked, expense.
- Ongoing Support and Maintenance: Think 24/7 support contracts, hosting fees (especially for on-premise XP deployments), and any retainers you have for continuous platform optimization and security updates.
By meticulously tracking every related expense, you create a transparent and honest financial baseline. This prevents you from underestimating the true investment and allows for a more credible ROI calculation that leadership can trust.
Identifying All Sources of Return
Now for the "profit" side of the equation. This is where Sitecore's value really starts to shine, but it’s also where things get a bit more complex than just looking at revenue. Your return comes from multiple streams—some direct, some indirect.
Think about it like this: a SharePoint intranet's value is often measured in internal efficiency gains, not direct sales. Sitecore's impact is similar in its breadth. Its value stretches far beyond the checkout page. The key is to quantify gains across several critical areas, leveraging the platform’s full capabilities.
Direct Revenue and Conversion Uplift
This is the most straightforward part to measure. You can draw a direct line from activities managed in Sitecore to the money coming in.
- E-commerce Sales: This is as direct as it gets—tracking transactions that come from personalized user journeys or targeted campaigns within Sitecore Experience Commerce or an integrated commerce solution.
- Lead Generation Value: You need to assign a monetary value to leads from form submissions, content downloads, or demo requests. You can do this based on your historical lead-to-customer conversion rates. For a more detailed look at this, you might be interested in our guide on using a DXP ROI calculator to measure digital investment impact.
- Goal Conversions: This involves measuring the completion of specific, high-value actions you've set up in Sitecore, each with its own assigned financial value.
When you connect these front-end user actions to your back-end financial data, you create a clear link between Sitecore’s features and your business income. This is the foundation of your ROI story, giving you tangible proof of financial success.
Choosing KPIs That Truly Matter in Sitecore XP
Your ROI calculation is only as good as the data you feed it. To really get a handle on ROI, you need to pick Key Performance Indicators (KPIs) that connect what you do on the platform directly to what happens in your bank account. It's time to forget about vanity metrics like page views—we need to focus on what actually moves the needle on business outcomes.
Inside Sitecore Experience Platform (XP), this means digging deeper than surface-level analytics. You have to configure the system to track the user actions that matter most, isolating the specific interactions that lead to a sale or a qualified lead. This is where Sitecore's built-in analytics and marketing automation become your most powerful tools.
This infographic gives you a great visual breakdown of three critical ROI metrics—revenue growth, cost savings, and lead conversions—and how they stack up.
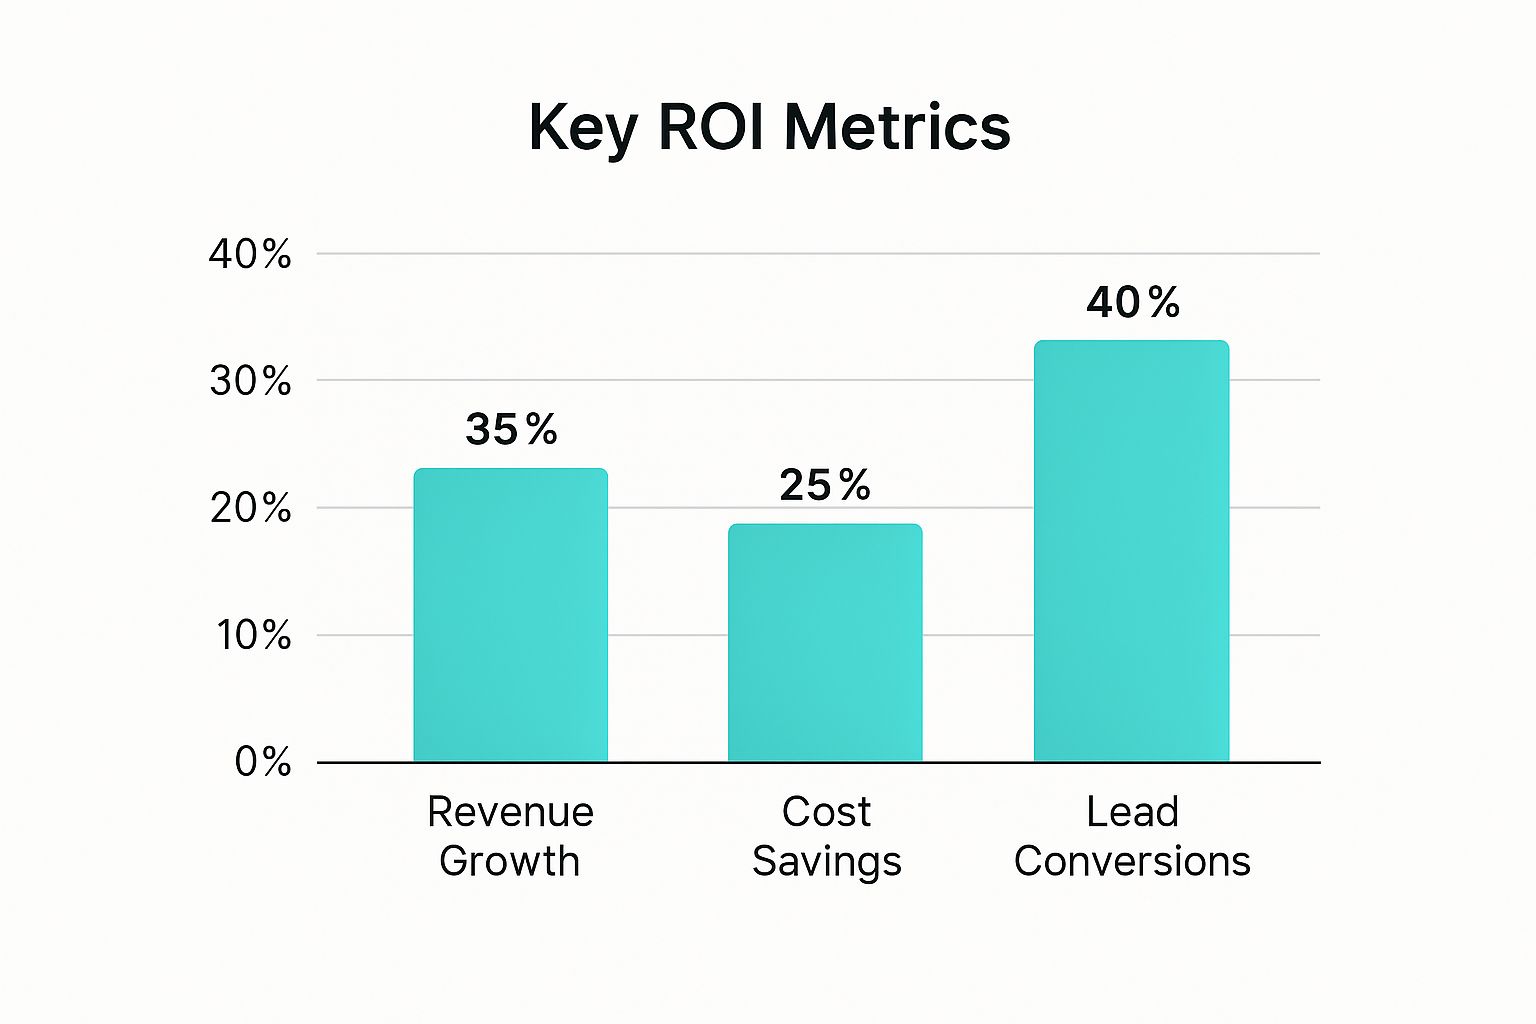
As you can see, lead conversions often make up a huge chunk of the total ROI, which proves why you need to track metrics that go beyond direct sales figures.
Connecting Sitecore Metrics to Business Goals
The real magic of Sitecore is its ability to track detailed user behavior and then assign a value to it. By setting up specific goals and events within the platform, you can start putting real numbers to the impact of your digital experiences. This is how you turn abstract user clicks into solid data for your ROI formula.
- Goal Completions: These are the big-ticket actions you want users to take. Think "Request a Demo," "Submit Contact Form," or "Subscribe to Newsletter." You can assign a specific monetary value to each goal based on what a lead is typically worth, tying it directly to potential revenue.
- Content Downloads: When a user downloads a whitepaper, case study, or spec sheet from your Sitecore-managed assets, it's a strong signal of their intent. This action tells you they're moving down the sales funnel, making it a vital KPI for any B2B lead generation strategy.
- Engagement Value Score (EVS): Sitecore's EVS is a running tally based on every goal a user completes. As a user's EVS climbs, it's a powerful indicator that their engagement is increasing and they're getting closer to converting. It’s a fantastic predictor of future revenue.
By translating user interactions into quantifiable metrics like Engagement Value, you create a direct link between operational performance and financial return. This allows you to prove that an improved digital experience is not just a user benefit but a tangible business asset.
The table below shows how you can map specific KPIs available in Sitecore to the broader business objectives your leadership team actually cares about.
Mapping Sitecore KPIs to Business Objectives
This kind of mapping is what bridges the gap between the marketing department and the C-suite, making the value of your digital efforts crystal clear.
KPIs for E-Commerce and Lead Generation
While the core idea is the same, the specific KPIs you'll want to watch will depend on your business model. Both models, however, require a laser focus on actions that directly influence the "Net Profit" side of your ROI equation. A classic mistake is getting lost in a sea of metrics instead of homing in on the vital few.
For e-commerce businesses running on a platform like Sitecore Experience Commerce, the metrics are pretty straightforward:
- Conversion Rate: The percentage of visitors who actually complete a purchase.
- Average Order Value (AOV): How much, on average, a customer spends in a single transaction.
- Customer Lifetime Value (CLV): The total amount of money a customer is expected to spend with your business over their entire relationship.
For B2B or lead generation, the game is all about qualifying potential customers and measuring efficiency:
- Cost Per Lead (CPL): How much marketing spend it takes to get a single lead.
- Lead-to-Opportunity Ratio: The percentage of leads that the sales team accepts as genuinely qualified opportunities.
- Marketing Qualified Leads (MQLs): Leads that have shown enough interest through their online behavior to be considered more likely to become a customer.
This fundamental concept of measuring return against cost is a universal business principle. In fact, ROI methodology has been adopted by over 2,000 organizations worldwide across nearly every sector to evaluate efficiency.
If you'd like more in-depth guidance on choosing the right metrics, we have a detailed article on how to develop content KPIs for enterprise CMS platforms. And to broaden your perspective, it's worth reviewing these essential customer service key performance indicators to see how other departments measure success.
Collecting and Analyzing Your Platform Data

Let's get one thing straight: your ROI calculation is only as good as the data you feed it. You can have the perfect formula, but if your data collection is a mess, the final number will be totally meaningless. This is the part where you connect the dots between the KPIs you chose and what's actually happening on your platforms.
For a powerhouse like Sitecore, this means getting your hands dirty and meticulously configuring its analytics. For an internal collaboration hub like SharePoint, it’s all about setting a solid baseline so you can prove you’ve actually made things more efficient.
Configuring Sitecore for Accurate Data Capture
The real magic of Sitecore is its ability to track every tiny detail of the user journey. But here's the catch—it's not a feature you just flip on. To get the data you need for a credible ROI analysis, you have to proactively set up tracking for the specific user actions that matter to your business goals.
Proper configuration is the difference between collecting random data and collecting the right data.
- Goals and Events: This is your foundation. You need to define specific user actions as Goals (like "Demo Request Submitted") or Events (like "Video Watched >75%"). Critically, every Goal should have a monetary value attached to it, which directly links user behavior to potential revenue.
- Campaign Tracking: Don't let your marketing efforts go untracked. Every email blast, paid ad, or social media push needs to be tagged with unique campaign identifiers. This is how Sitecore attributes conversions and Engagement Value back to the specific campaigns that are actually working.
- Profile and Pattern Cards: By setting up user profiles, you can start segmenting your audience based on their behavior. This lets you see which types of users are driving the most value, which is gold for your personalization strategy and, ultimately, your ROI.
A classic mistake is to set up tracking once and then just forget about it. Your data strategy needs to be a living, breathing thing. Make a habit of regularly reviewing your goals and events to make sure they still line up with where your business is headed.
Integrating Sitecore with Your CRM
Sitecore tells you a ton about what people do on your website, but that's only half the story. The other half—what happens after they fill out a form and become a lead—is locked away in your Customer Relationship Management (CRM) system. To get a true ROI picture, you have to bring these two worlds together.
When you integrate Sitecore with your CRM, you get a single, unified view of the entire customer lifecycle. You can follow a user from their very first anonymous visit all the way to a closed deal. This integration is crucial for proving the long-term value of what you're doing. To get your data and analysis processes in top shape, it’s worth looking at frameworks like a content marketing operations maturity model.
A solid integration helps you answer the big ROI questions:
- Which of our Sitecore campaigns generated the most qualified leads?
- What content did our highest-value customers actually look at before they converted?
- Does a high Engagement Value Score in Sitecore mean a shorter sales cycle in our CRM?
If you want to dig deeper into connecting these systems, check out our guide to https://www.kogifi.com/articles/customer-data-integration-solutions.
Measuring Internal Efficiency in SharePoint
When you’re trying to calculate the ROI of an internal tool like SharePoint, the game changes. You're not tracking revenue; you're tracking productivity and cost savings. The goal is to put a number on efficiency, and that requires a totally different approach to data collection that starts long before the project is done.
You have to establish a pre-project baseline. It’s simple: if you don’t know how things worked before SharePoint, you have no way to prove it made anything better.
Baseline Measurement Techniques
- Time-Tracking Studies: Before you even start the implementation, grab a group of employees and have them log how long it takes to do specific tasks. Think "find a required document" or "collaborate on a project proposal."
- User Surveys: Get a feel for how frustrated people are with the current way of doing things. Ask about the pain points related to finding information, version control chaos, and clunky team communication.
- IT Ticket Analysis: Dig into your helpdesk tickets. A high number of tickets related to document management or old collaboration tools represents a hidden cost that SharePoint is designed to slash.
Once SharePoint is up, running, and people are using it, you run the exact same studies and surveys again. The difference between your "before" and "after" numbers is the heart of your ROI calculation. It lets you assign a real dollar value to hours saved and support costs eliminated.
Using Sitecore Personalization to Boost ROI
Personalization in Sitecore is much more than a "nice-to-have." It’s a powerful engine for driving your return on investment. The real magic happens when you move beyond just setting up personalization rules and start rigorously measuring their financial impact. This is how you prove that your strategy isn't just making the user experience better—it's actively growing the business's bottom line.
To get this right, you have to treat your personalization efforts like a series of scientific experiments. This means designing and running controlled tests—like A/B or multivariate tests—on specific personalized components using Sitecore's built-in testing features or Sitecore Personalize. By isolating one change at a time and comparing a personalized experience against the default, you can quantify the exact lift in conversions.
Designing Tests to Quantify Personalization Impact
A solid testing methodology is the bedrock for measuring personalization ROI. It’s not enough to launch a personalized campaign and just hope it works. You need a clear hypothesis and a controlled environment to prove it.
Let's take a common scenario: personalizing the homepage banner for different audience segments.
- Segment A (New Visitors): You hypothesize that showing them a "Discover Our Solutions" banner will drive more engagement than a generic welcome message.
- Segment B (Returning Customers): You believe a banner promoting a new loyalty program feature will lead to more repeat purchases.
Inside Sitecore, you can set up a multivariate test where the default banner runs against these two personalized variations. The platform will then track how each version performs against predefined goals, like "Clicked on Banner" or, even better, "Completed a Purchase." This simple process turns a creative idea into a hard, data-driven conclusion.
A Real-World Personalization Scenario
Let’s walk through a tangible example. Imagine an e-commerce company that sells high-end electronics using Sitecore. They’ve noticed visitors coming from a tech review blog are mostly interested in product specs, while visitors from a lifestyle blog care more about design and aesthetics.
They decide to personalize the product detail page based on this insight.
- The Control: The standard page shows a mix of technical specs and lifestyle images.
- Variation for Tech Blog Visitors: This page is personalized to lead with an in-depth specifications table and a video review from a tech expert.
- Variation for Lifestyle Blog Visitors: This version highlights a gallery of high-resolution product photos and customer testimonials about the product's design.
After running this A/B/n test for a month, the data in Sitecore Analytics reveals a 15% increase in "Add to Cart" goal completions for the tech-focused variation and an 18% increase for the lifestyle-focused one, both compared to the control. Now you have concrete numbers proving the value of this specific personalization rule. For more practical guidance on setting this up, check out our article on 5 simple steps toward better personalization with Sitecore Personalize.
Translating Engagement into Monetary Value
Seeing a lift in goal completions is a great start, but the real objective is to connect that lift directly to revenue. This is where Sitecore's value-per-visit metric becomes absolutely critical. Before you run any tests, you have to assign a monetary value to each key goal on your site.
For an e-commerce "Add to Cart" goal, this value might be the average order value multiplied by your cart-to-purchase conversion rate. For a B2B "Download Whitepaper" goal, it could be the average value of a sales-qualified lead.
Once these values are configured, every goal completion contributes to a visitor's Engagement Value Score (EVS). This allows Sitecore to automatically calculate the financial uplift generated by your personalized experiences. The conversation shifts from "we increased clicks" to "this personalization rule generated an additional $25,000 in potential revenue last quarter."
This approach completely changes how you think about ROI. It’s no longer some abstract financial calculation done months later. Instead, it becomes a live, ongoing measure of your strategic effectiveness. Think of it like a financial investor comparing returns across different assets. Historical data shows the S&P 500 returned a massive 69.35% in 1958, a figure that completely eclipsed safer assets like bonds, showing the huge potential of a well-executed strategy. You can see more on these historical investment returns and what they mean on pages.stern.nyu.edu. In the same way, a well-tested personalization initiative can deliver outsized returns compared to more passive digital marketing efforts.
Calculating the ROI of Your SharePoint Solution

While platforms like Sitecore often have their ROI tied to external metrics like lead generation and e-commerce sales, SharePoint's value is found closer to home—right within your internal operations. Calculating its ROI requires a mindset shift from tracking revenue to measuring cost savings and productivity gains. You’re not counting customer conversions; you’re measuring how much faster, smarter, and more securely your teams can get their work done.
The real trick to a solid SharePoint ROI calculation is putting a dollar value on improvements that often feel intangible. We're talking about saved time, reduced risk, and smoother collaboration. When you do this, you transform abstract benefits into a powerful business case that leadership can actually get behind.
Pinpointing Productivity Gains and Cost Savings
The biggest wins from a well-implemented SharePoint solution almost always come from streamlining day-to-day operations. These gains are very real and measurable, but you have to know where to look. The first step is to zero in on the specific processes SharePoint was meant to fix.
We recommend starting with these key areas:
- Process Automation: What manual, repetitive tasks did you automate using Power Automate within SharePoint? Think about things like invoice approvals, new employee onboarding, or project status reports. Calculate the hours saved per week, then multiply that by the average hourly cost of the employees involved.
- Information Retrieval: Take a hard look at how much time people used to spend hunting for documents across scattered network drives, email inboxes, and their own local machines. SharePoint’s robust search and metadata capabilities dramatically cut down this "search time," freeing up countless hours for more valuable work.
- Collaboration Efficiency: How much time are you saving with co-authoring, centralized project sites, and streamlined version control? This puts an end to the endless back-and-forth of emailing different document versions—a huge source of wasted time and costly errors.
The secret to a convincing SharePoint ROI is establishing a clear "before" and "after" picture. You must benchmark your current state before implementation. Without a baseline, any claims of improvement are just guesswork.
Methods for Quantifying SharePoint's Value
Once you know what to measure, you need practical ways to get the data. This usually involves a mix of hard numbers and qualitative feedback, which together paint a complete picture of SharePoint's impact.
A powerful technique is conducting time-and-motion studies. Pick a group of employees and have them track how long it takes to do specific tasks—like finding a policy document or routing a contract for signatures—both before and after the SharePoint rollout. That difference, once you assign a dollar value to the time, becomes a core part of your ROI.
Another great tool is employee surveys. Yes, they’re subjective, but they provide invaluable data on perceived efficiency gains. Ask targeted questions like, "On a scale of 1-10, how much easier is it to collaborate with your team now?" or "Estimate how many hours you save per week thanks to having all your documents in one place." This kind of feedback helps quantify benefits that are tough to track with a stopwatch.
Assessing Risk Mitigation and Compliance
Beyond straight productivity, SharePoint delivers serious value by reducing organizational risk, and you absolutely should not overlook this in your ROI analysis. Better compliance and security have a real financial upside, even if it’s measured in "costs avoided" rather than "revenue earned."
Think about the financial impact of:
- Improved Document Control: SharePoint offers robust versioning and access controls. This drastically reduces the risk of someone using outdated information or an unauthorized person getting their hands on sensitive data.
- Enhanced Audit Trails: The platform automatically logs who accessed or changed a document. This makes it much easier to comply with regulations like GDPR or SOX and helps you sidestep potential fines.
- Disaster Recovery: Having your critical documents centralized on a secure, backed-up platform is your best defense against data loss from hardware failure or a cyberattack.
Measuring the performance of an investment is a universal concept. Just as investors analyze historical stock market returns to see if a strategy is working, you’re analyzing internal metrics to judge your SharePoint investment. For instance, the S&P 500 has seen wildly variable returns in recent years, from -18.1% to 31.5%, which shows just how much performance can fluctuate. Your SharePoint ROI calculation is a similar exercise in assessing performance against an investment. You can discover more insights about how historical returns are calculated on businessinsider.com.
Common Questions About Measuring Platform ROI
Even with a solid framework, you're bound to run into questions when measuring the ROI of a complex platform like Sitecore or SharePoint. The process is rarely a straight line. Knowing how to navigate the common bumps in the road is what separates a flimsy report from a credible analysis.
Let's dig into some of the most frequent questions we hear from clients.
How Long Should I Wait to Measure ROI on a New Implementation?
This is probably the most common—and critical—question we get. For a big DXP like Sitecore, you have to resist the temptation to run an ROI analysis in the first three months. It’s just too soon. All your big costs are front-loaded (implementation, training, content migration), while the real benefits, like those from personalization and SEO gains, need time to actually kick in.
A much more realistic timeline is to run your first proper ROI analysis after six to twelve months. This window gives you enough breathing room for a few key things:
- You'll have enough data to spot real trends, not just initial noise.
- The platform’s SEO benefits will start to show up in search rankings.
- Your team will be proficient enough to actually use advanced features like personalization effectively.
For an internal platform like SharePoint, the timeline can be a bit shorter. You can often start measuring productivity wins from process automation or better document access within three to six months. Those internal efficiencies just show up a lot faster than external revenue growth.
What If My Platform Lacks Direct E-commerce Revenue?
This is a huge one, especially for B2B companies using Sitecore for lead generation or organizations using SharePoint as their intranet. When you can't point to a shopping cart, you have to get creative and assign a clear monetary value to other key outcomes. The goal is to connect platform activity to financial value, even if it's indirect.
The biggest mistake you can make is assuming that a lack of direct transactions means you can't calculate ROI. You have to learn to translate efficiency, engagement, and productivity into the only language the finance department speaks: dollars and cents.
This means putting a dollar value on non-transactional conversions. For example, you can calculate the historical value of a sales-qualified lead by looking at your lead-to-customer conversion rate and the average customer lifetime value. For a SharePoint intranet, you could calculate the cost savings from reducing the time employees spend hunting for documents.
How Do I Isolate My Platform's Impact from Other Marketing Efforts?
Correctly attributing revenue is always a challenge. A customer might see a social media ad, get an email, and then finally convert after a personalized journey on your Sitecore site. How do you give Sitecore the credit it deserves?
The answer is to move beyond simplistic attribution models. As detailed in resources like Sitecore’s own documentation, a "last-click" model that gives 100% of the credit to the final touchpoint just doesn't cut it anymore.
Instead, you need a multi-touch attribution model—like a U-shaped or linear model—that distributes credit across the entire customer journey. This gives you a far more accurate picture of how your Sitecore experience influenced the final sale, recognizing that the platform is a critical piece of a much larger ecosystem.
At Kogifi, we specialize in helping businesses untangle the complexities of platform ROI. Our experts can help you implement the tracking, configure the analytics, and build the business case needed to prove the true value of your digital investments. Visit us at https://www.kogifi.com to learn how we can help you measure what matters.