


The popular advice is simple: track more customer engagement metrics, put them on a dashboard, and let the patterns guide your decisions. That approach fails in many enterprise environments. A beautifully reported click-through rate can't explain why a customer abandoned a journey if marketing, CRM, commerce, service, and ERP data remain disconnected.
Effective measurement starts with a harder question: can the organization act on the signal while it still matters? Sitecore XM Cloud and SharePoint can capture valuable behavior, but only when teams define events consistently, connect them to outcomes, and assign ownership for what happens next. Surveys still have a role, yet behavior-level instrumentation often reveals friction that customers don't articulate in a questionnaire.
Table of Contents
- Behavioral metrics show what people do
- Sentiment metrics add the customer's perspective
- Outcome metrics connect engagement to value
- Channel metrics explain local performance
- Scenario one, declining session depth
- Scenario two, weak feature adoption
- Scenario three, churn signals
- How do you measure engagement when data is fragmented?
- Should surveys remain central to measurement?
- What's the difference between a vanity metric and an actionable metric?
- How often should metric definitions change?
Why Most Engagement Metrics Fail to Drive Action
More data doesn't automatically create better engagement. It often creates more reports, more conflicting definitions, and more meetings where nobody can decide what to change.
The measurement gap is structural. 54% of enterprises cannot access and use real-time data, 60% sit on dark data, and only 30% share engagement data with a CX or CRM platform, according to the 2026 Global Customer Engagement Index. A marketing team may see campaign interactions, a service team may hold resolution data, and commerce may own purchase history, but the customer experiences those touchpoints as one journey.

The plumbing matters more than the metric list
A metric becomes useful when four conditions exist:
- A defined event: The team knows precisely what counts as activation, qualified engagement, form completion, or resolution.
- A reliable identity model: Anonymous visits, authenticated users, accounts, and contacts can be connected without creating unsafe or misleading profiles.
- A decision owner: Someone knows which team responds when the signal changes.
- An activation path: The organization can adjust content, personalization, workflow, service, or product experience based on the finding.
Without those conditions, NPS becomes a presentation number, page views become traffic decoration, and conversion rate becomes an argument about attribution. The issue isn't that these metrics are weak. The issue is that teams frequently measure them without the integration and operating model needed to interpret them.
Practical rule: Don't add a metric to an executive dashboard until you can name the decision it will change.
A Sitecore implementation illustrates the problem clearly. XM Cloud may deliver content through headless experiences, while customer context sits in a CRM and transaction data lives in commerce. If the organization tracks page views but can't connect content interaction to authenticated behavior or downstream action, the dashboard describes activity without explaining value.
The same applies to SharePoint. A document view may indicate relevance, accidental navigation, or a failed search experience. Until the team connects document interaction with search refinement, repeat visits, task completion, or workflow participation, the number remains ambiguous.
Teams building richer forms should also consider interactive form strategies, particularly when a form is part of a longer journey. The useful measurement isn't only submission count. It includes starts, field-level friction where privacy policy permits, abandonment, validation errors, and what happens after submission.
The right reframing is not “which metrics should we track?” It is which connected signals can support a decision, at the right moment, with an accountable owner?
The Four Categories of Customer Engagement Metrics
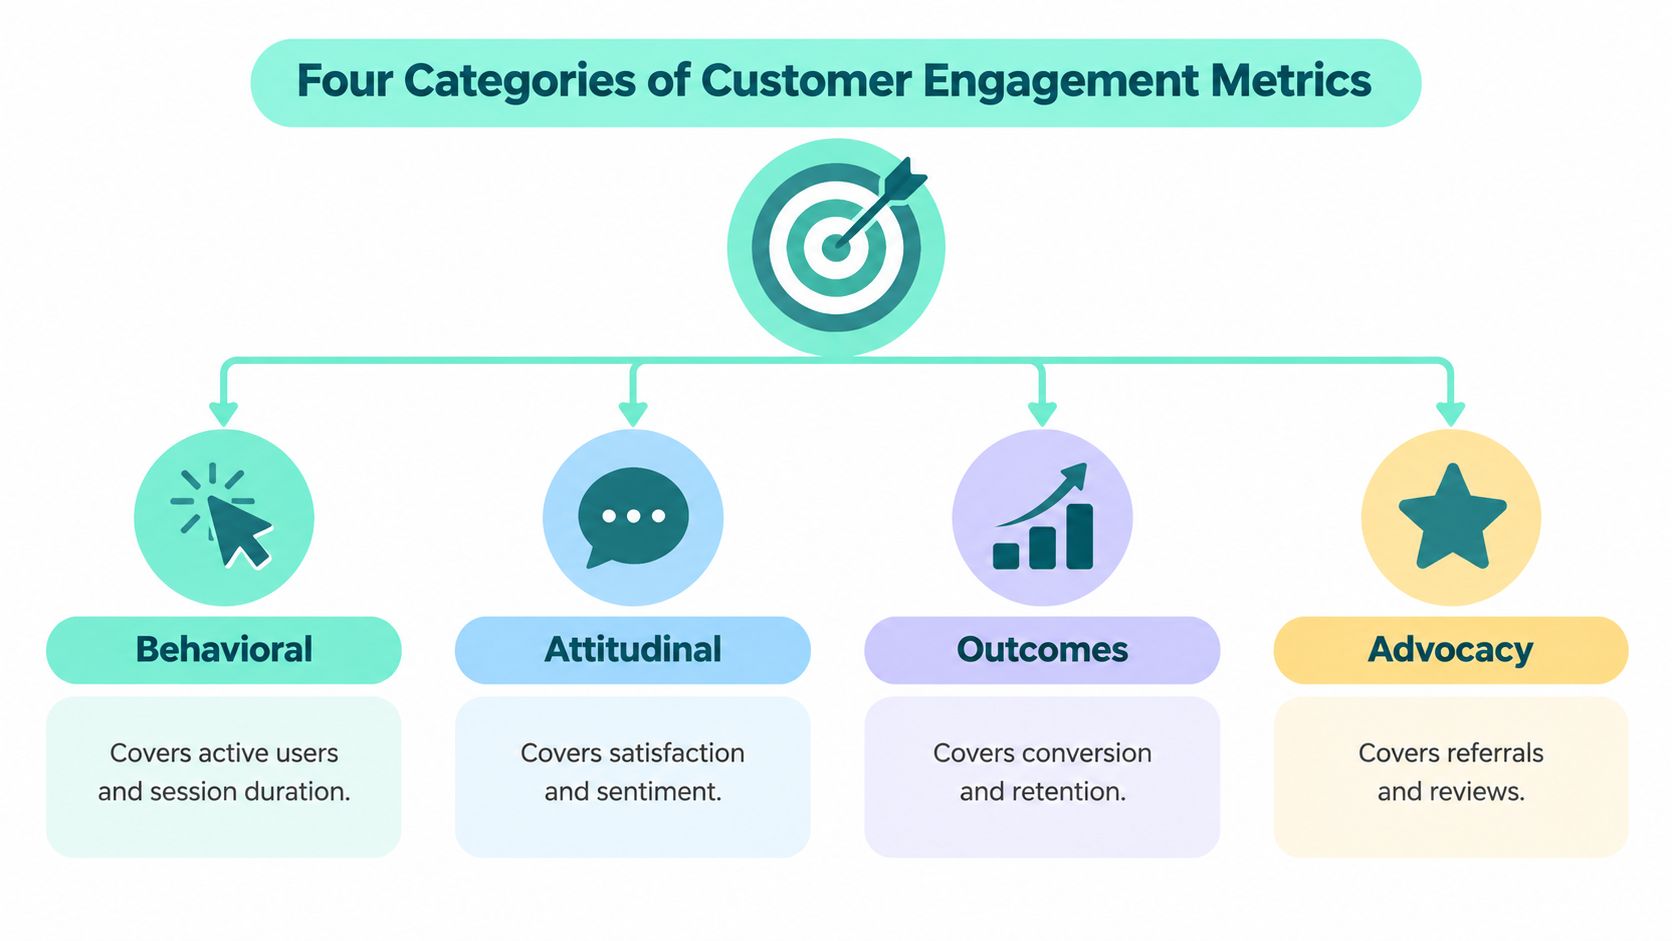
Customer engagement is multidimensional. The research on customer engagement constructs distinguishes behavioral, cognitive, and emotional components, and validated scales include observable behaviors such as co-developing, sharing, socializing, advocating, and learning. A practical enterprise taxonomy expands that thinking into behavioral, sentiment, outcome, and channel-specific measures.
Behavioral metrics show what people do
Behavioral measures include daily, weekly, and monthly active users, session length, feature adoption rate, repeat visits, interaction depth, and product stickiness. On a Sitecore-powered commerce site, useful events might include product comparison, internal search refinement, account login, saved item activity, and checkout progression.
On a SharePoint intranet, the equivalent signals may include search use, document views, news interaction, return visits, and workflow participation. A page view alone tells you little. A sequence showing search, document opening, download, and successful task completion tells you much more about whether the experience helped.
Sentiment metrics add the customer's perspective
NPS and CSAT can reveal how customers feel about an interaction or relationship. They're valuable because behavior doesn't always expose confidence, frustration, or perceived effort.
Use sentiment as a diagnostic layer, not a substitute for operational evidence. A low CSAT score attached to a resolved support journey means something different from a low score attached to a failed authentication flow. Store the survey response alongside journey, channel, issue type, and outcome context.
Outcome metrics connect engagement to value
Outcome measures include activation rate, conversion rate, churn rate, customer lifetime value, repeat purchase rate, and average order value. The customer engagement metrics framework from Twilio groups engagement measurement around behavioral, sentiment, outcome, and channel-specific perspectives, linking interaction quality with retention and churn.
The key is to define the causal path carefully. A content interaction may assist a conversion without being the final touch. A portal visit may support renewal without producing an immediate transaction.
Channel metrics explain local performance
Email open rate, click-through rate, click-to-open rate, conversion rate, unsubscribe rate, social engagement, and website bounce rate belong to the channel layer. Benchmark material for 2025 to 2026 reports an average email open rate of 35.6%, email bounce rate of 0.7%, broad social engagement around 0.71%, and website bounce rates commonly between 41% and 51%, as summarized by MoEngage customer engagement benchmarks.
These figures are directional context, not universal targets. A multilingual enterprise site, an employee intranet, and a transactional email program shouldn't share the same threshold. For teams automating survey collection, automated NPS reporting can reduce manual consolidation, but the result still needs journey and outcome context.
Instrumenting Metrics in Sitecore XM Cloud and SharePoint
Instrumentation should begin with the customer journey, not the reporting tool. Define the actions that indicate progress, then map those actions to platform events, identity, content, and outcomes.
Sitecore XM Cloud is described as a fully managed, self-service cloud platform that includes the Pages editor, Sitecore Headless Experience Accelerator, Headless Services, the Sitecore Next.js SDK, and Experience Edge. It also supports a cloud-native, hybrid headless CMS model with automatic updates and GitOps support, as documented in the XM Cloud introduction.
Sitecore XM Cloud implementation
Start by creating an event dictionary. Name events for business meaning, not implementation detail. “Product detail viewed,” “quote request started,” and “quote request submitted” are more useful than ambiguous labels such as “button event.”
Then implement the event payload across the rendering layer and headless front end:
- Define the event contract. Include page, component, content ID, language, site, campaign context, anonymous or authenticated state, and relevant journey identifiers.
- Capture progression. Track meaningful interactions such as search refinement, scroll engagement, form start, form abandonment, account action, and conversion. Don't treat every click as an engagement event.
- Connect outcomes. Send conversion and retention signals into the analytics or customer data environment that owns reporting. Confirm that the same identity rules apply across CRM and commerce.
- Validate with test journeys. Test consent states, localization, errors, duplicate firing, server-side rendering, and client-side navigation. Headless implementations can lose events when route changes aren't handled correctly.
The Google Analytics event tracking guidance is useful when teams need to align event names and reporting behavior across analytics implementations.
SharePoint implementation
SharePoint Online offers usage reporting, while Microsoft 365 audit data can add administrative and activity context. Power Platform connectors can move selected signals into workflows, dashboards, or notifications. For deeper interaction analysis, teams may combine SharePoint data with Microsoft Clarity, custom events, and Power BI where governance permits.
Track the full task, not just the page:
- Search behavior: Query, result selection, refinement, and exit behavior.
- Document interaction: Open, preview, download, share, and failed access.
- Workflow completion: Start, approval step, rejection, completion, and elapsed process state.
- Content relevance: Return visits, news interaction, and task-oriented navigation.
The common mistake is measuring page views without scroll or task context, or counting form submissions without starts and abandonment. Those gaps make a successful-looking page appear healthy even when users struggle to complete the job.
Selecting and Prioritizing Metrics for Enterprise Goals
A useful metric earns its place by combining strategic relevance, data availability, actionability, and measurement cost. A daily active user count may look impressive for a portal, but weekly return behavior or completed employee tasks may better reflect value. NPS may matter to leadership, yet it won't help a service team unless feedback reaches the workflow where someone can respond.
| Business Goal | Primary Metrics | Secondary Indicators | Platform Focus |
|---|---|---|---|
| Acquisition | Qualified conversion rate, completed lead journey | Channel engagement, landing-page interaction, form abandonment | Sitecore XM Cloud, analytics, CRM |
| Retention | Churn rate, repeat purchase rate, retention behavior | Session depth, support resolution, CSAT | Sitecore, commerce, CRM, service |
| Expansion | Customer lifetime value, average order value, feature adoption | Content engagement, account activity, advocacy | Sitecore, commerce, CRM |
| Employee productivity | Completed tasks, search success, workflow completion | Document interaction, return visits, news engagement | SharePoint, Microsoft 365, Power Platform |
| Brand advocacy | Referrals, reviews, advocacy behavior | NPS, sharing, community participation | Sitecore, CRM, marketing automation |
A practical prioritization method
Choose one primary KPI for the current business decision. Add secondary indicators that explain movement, then retain diagnostic metrics for investigation. This tiered model prevents a dashboard from treating every signal as equally important.
For a B2B portal, lead progression and authenticated task completion usually deserve priority over raw traffic. For commerce, conversion and repeat purchase behavior should be read with search, product interaction, and checkout friction. For an intranet, successful information retrieval and workflow completion are more meaningful than broad page popularity.
The platform's maturity changes what you can responsibly measure. If identity resolution is incomplete, don't present account-level lifetime value as precise. If event governance is weak, start with a smaller set of validated actions rather than adding more tags.
A connected customer 360 view can help teams align behavioral, commercial, and service context, but the view only becomes useful when owners agree on definitions and permitted uses. Prioritization isn't a contest to collect every possible signal. It's a decision to make a few measures trustworthy enough to guide investment.
Dashboarding and Governance Best Practices
A dashboard should answer three questions quickly: what changed, why might it have changed, and who should act? Executive views need trends, outcomes, and material exceptions. Marketers need campaign and journey diagnostics. Product and platform teams need event health, performance context, and implementation detail.
Don't put all audiences in one view. Role-based dashboards reduce interpretation time and prevent technical diagnostics from obscuring business priorities.
Design for investigation
Use trend lines instead of isolated snapshots. Add annotations for releases, campaigns, navigation changes, personalization rules, and service incidents. Define alert thresholds only when an owner and response playbook exist. An alert without a response creates noise.
A metric dictionary should record:
- Definition: What the metric means and what it excludes.
- Source: Which platform, event, or system supplies the value.
- Owner: Who validates it and who acts on movement.
- Grain: Whether it describes a session, user, account, content item, or journey.
- Quality rule: How missing, duplicated, delayed, or consent-restricted data is handled.
- Review record: When the definition was last approved or changed.
For teams evaluating dashboard products, it can help to compare SEO dashboard tools, especially when search visibility is one input into a broader content and engagement program. SEO reporting still needs to connect with on-site behavior and business outcomes.
Govern the estate, not just the report
Multi-brand and multilingual Sitecore estates need shared event naming, controlled taxonomies, and clear exceptions. SharePoint environments need ownership for sites, document classes, permissions, retention, and workflow signals. A governance group should include marketing, digital product, data, IT, privacy, and business owners.
Survey data deserves careful handling. Independent coverage reports that 66% of CX practitioners believe experience improved, while only 17% of consumers agree, and that nearly one-third of consumers experienced a problem in their latest interaction, according to CMSWire's coverage of the Medallia report. The same coverage reports survey email open rates fell about 6% and response rates about 11% year over year.
That doesn't make surveys obsolete. It means governance should combine survey sentiment with operational outcomes, behavioral retention, delivery signals, session behavior, and triggered interactions. Teams documenting ownership and lifecycle rules can use a structured content governance framework to keep definitions aligned as the estate changes.
Action-Oriented Optimization Tactics with Examples
Metrics matter only after someone turns them into a hypothesis. A useful operating loop is: observe a meaningful change, segment the affected journey, inspect qualitative and technical evidence, make one controlled change, and measure the downstream result.
Scenario one, declining session depth
Suppose a high-value Sitecore journey shows shorter sessions and fewer users reaching comparison content. Don't immediately add more content. Check navigation paths, internal search refinement, rendering performance, mobile behavior, and whether campaign landing pages match the next step.
A sensible intervention may be a navigation restructure, stronger contextual links, or a component variation in the headless front end. The success measure shouldn't be session duration alone. Pair it with progression to the relevant action, form completion, or qualified conversion.
Scenario two, weak feature adoption
When a portal feature receives little use, the first question is whether users know it exists. The second is whether they can complete the task. In XM Cloud, segment feature exposure by page, audience, language, and authenticated state. In SharePoint, compare feature discovery with search behavior, document interaction, and task completion.
An onboarding redesign might include contextual guidance, clearer labels, an example-driven component, or a workflow simplification. Avoid claiming success from clicks alone. Confirm that users complete the intended task and return when the need recurs.
Scenario three, churn signals
Rising churn requires more than a retention banner. Connect account behavior, service history, product usage, content interaction, and sentiment where consent and data policy allow. A personalization strategy may then prioritize help content, renewal guidance, service recovery, or a relevant expansion path.
Behavior-triggered communication generally gives teams better context than broad broadcasts. Coverage of recent engagement research reports journey-based in-app messages converting nearly 1 in 2 active users, while behavior-triggered messages outperform broad broadcasts and generic messages can produce much higher unsubscribe rates, as reported by CMSWire. Use the earlier source link only as context here, without treating the result as a universal forecast.
For content teams, metrics for content marketing provide useful diagnostic ideas such as return visits, CTA clicks, internal search refinement, video completion, and form starts. Kogifi can be one implementation option for teams that need Sitecore, SharePoint, analytics enablement, personalization, or integration work aligned to these signals.
Frequently Asked Questions About Engagement Metrics
How do you measure engagement when data is fragmented?
Create a shared event dictionary first, then establish a stable identity and journey key across Sitecore XM Cloud, SharePoint, CRM, commerce, service, and analytics. Start with a small set of business-critical events, validate them across consent and localization states, and route them to a governed reporting layer. Don't wait for a perfect customer data platform before fixing inconsistent definitions.
Should surveys remain central to measurement?
Keep surveys as a sentiment signal, but don't make them the only evidence. Combine NPS and CSAT with retention, delivery, session behavior, task completion, resolution, and triggered interaction data. Surveys tell you how customers describe an experience. Behavior and operational outcomes show what happened around that response.
What's the difference between a vanity metric and an actionable metric?
A vanity metric reports activity without a clear decision path. An actionable metric has a defined owner, context, quality rule, and intervention. Page views can be useful for capacity planning or content reach, but they become actionable only when connected to the journey or outcome the team is trying to improve.
How often should metric definitions change?
Review definitions when the customer journey, platform architecture, consent model, or business objective changes. Schedule regular governance reviews, but don't alter a metric merely because the number is inconvenient. Preserve version history so teams can distinguish real behavior changes from changes in instrumentation.
Kogifi helps enterprise teams design and implement customer engagement measurement across Sitecore XM Cloud, Sitecore XP, SharePoint Online, Power Platform, CRM, commerce, and analytics environments. Visit Kogifi to discuss an instrumentation audit, event model, dashboard governance plan, or DXP modernization initiative tied to measurable customer and employee journeys.