

In the world of sophisticated Digital Experience Platforms (DXPs) like Sitecore and SharePoint, website performance is no longer just about page load speed. It's about delivering seamless, personalized, and fast digital experiences at every touchpoint. For a modern composable DXP, especially one leveraging Sitecore's portfolio including XM Cloud, OrderCloud, and Sitecore AI, standard uptime checks are insufficient. True observability requires a deep dive into both synthetic and real-user data, correlating frontend interactions with backend processes across a distributed architecture, and understanding the performance impact of dynamic content and AI-driven personalization.
This guide moves beyond generic lists. It offers an expert-vetted selection of website performance monitoring tools specifically for enterprise-level challenges. We will explore how platforms like Datadog, New Relic, and Dynatrace integrate with and support complex ecosystems built on Sitecore and SharePoint, empowering you to protect your digital investment and maximize ROI. For each tool, you'll find a concise summary, pros and cons, and notes on integration, all supported by screenshots and direct links to help your evaluation.
As specialists in Sitecore solutions, including the advanced capabilities of Sitecore AI, we understand that the right monitoring stack is foundational to digital success. This article is your direct path to finding the best tools for your specific needs, whether you're migrating to XM Cloud, managing a global SharePoint intranet, or optimizing a high-traffic e-commerce platform powered by OrderCloud. Let's explore the tools that provide the clarity and control you need to ensure every user interaction is flawless. We’ll analyze options from industry leaders like those found at sitecore.com to help you build a resilient and high-performing digital operation.
1. Datadog (Synthetics + Real User Monitoring)
Datadog provides a unified observability platform that excels at connecting front-end user experience with back-end application performance. It's a strong choice for enterprise teams, especially those managing complex Digital Experience Platforms (DXPs) like Sitecore or SharePoint, who need a single pane of glass to correlate website health with underlying infrastructure and service metrics. The platform combines proactive Synthetic Monitoring with reactive Real User Monitoring (RUM), giving you a complete picture of performance.
With Datadog, you can simulate user journeys from global locations to test availability and performance before users are impacted. Its RUM capabilities capture Core Web Vitals, session replays, and resource loading times from actual user sessions. This data is critical for understanding real-world bottlenecks. By gathering this front-end data, development teams gain actionable information needed to optimize website performance effectively, especially within the composable architecture of Sitecore's latest offerings.
Key Considerations
- Use Case: Ideal for correlating a slow page load on a Sitecore XM Cloud site directly to a specific SQL query, a call to Sitecore CDP, or an API call via its integrated Application Performance Monitoring (APM).
- Pros: Its most significant advantage is the tight integration between front-end and back-end telemetry. The extensive library of integrations and mature enterprise security features are also major draws.
- Cons: The unit-based pricing structure can be complex and may lead to high costs if you have massive traffic volumes or enable many advanced features. Session replay and some analytics are often add-on products.
- Implementation: Setup involves deploying the RUM browser SDK (a JavaScript snippet) and configuring Synthetic tests through the UI or via their API for CI/CD integration, which is essential for modern Sitecore development practices.
Website: https://www.datadoghq.com
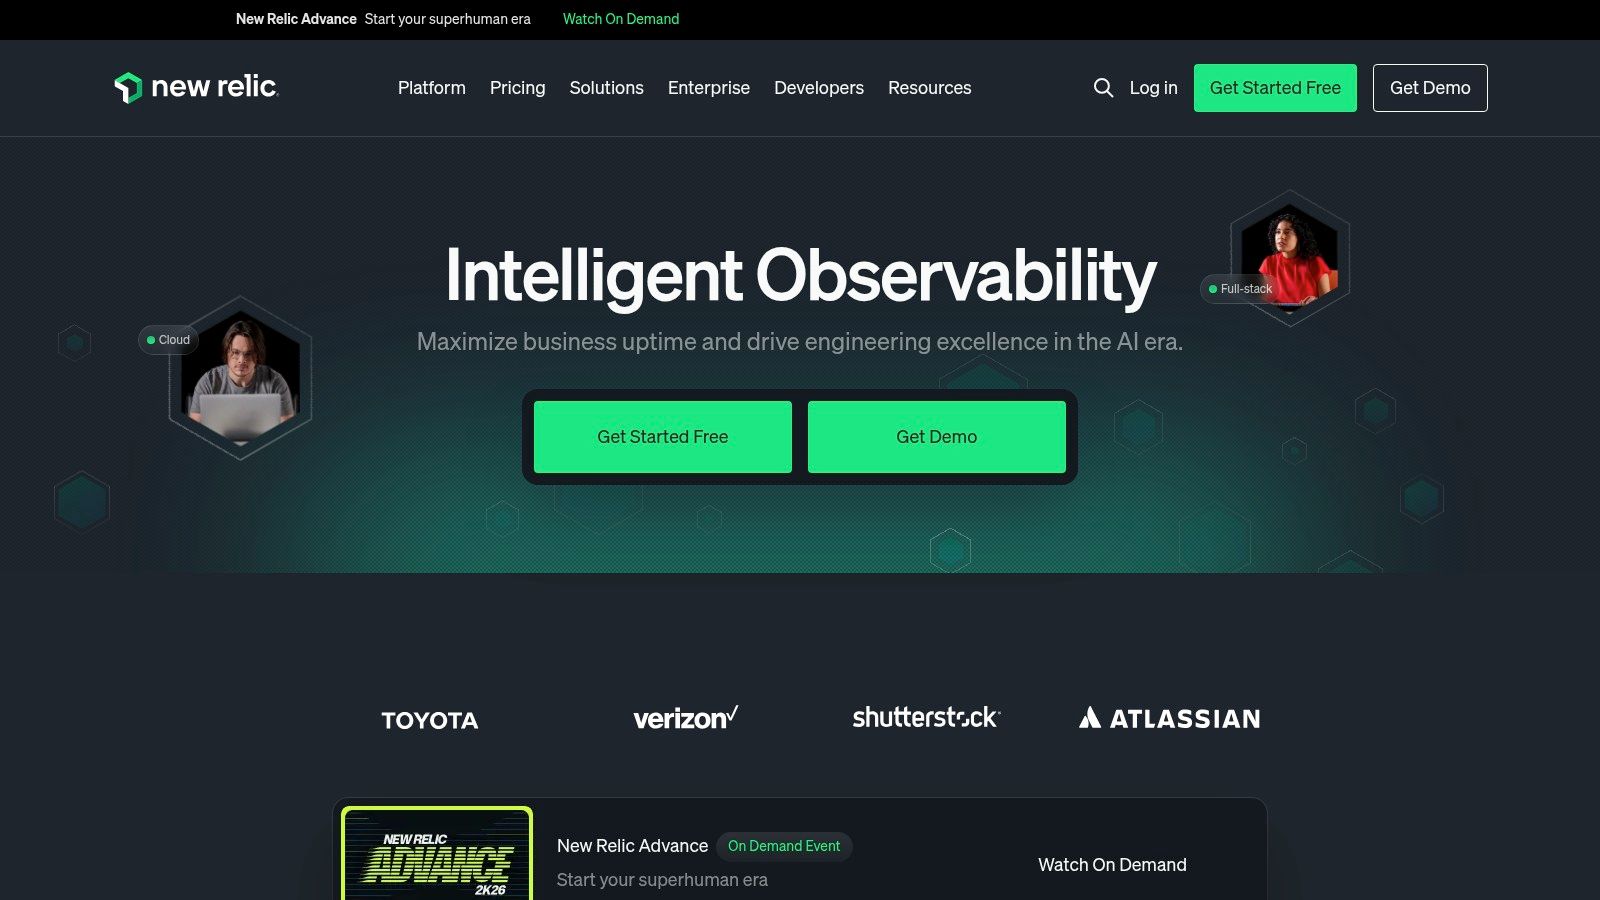
2. New Relic (Browser + Synthetics)
New Relic offers a complete observability platform with a strong focus on Digital Experience Monitoring (DEM). It integrates front-end performance data from its Browser (RUM) and Synthetics products with back-end APM, infrastructure, and logs. This makes it a great choice for teams who want a single, unified view of their entire stack, from user interactions on a Sitecore or SharePoint site down to the database queries supporting it. The platform excels at data visualization and powerful analytics.
The platform provides detailed RUM capabilities, capturing Core Web Vitals and page-level insights to diagnose real user experience issues. Its Selenium-powered scripted browser tests allow you to proactively monitor critical user flows. All this data can be queried using the New Relic Query Language (NRQL), allowing teams to build custom dashboards and alerts. These insights are essential for development teams, providing the data needed to improve your Sitecore performance and ensure the reliability of SharePoint solutions.
Key Considerations
- Use Case: Excellent for visualizing the full request lifecycle. For instance, you can trace a slow user interaction on a Sitecore-powered e-commerce page directly through the application stack to identify a bottleneck in a microservice or third-party API like Sitecore OrderCloud.
- Pros: The single platform for DEM and APM with strong data visualization is a major benefit. Its flexible data and user-based pricing editions can be more predictable than other models.
- Cons: The platform's breadth can present a steep learning curve, especially for mastering advanced NRQL queries. Large-scale deployments require careful cost governance to avoid unexpected expenses.
- Implementation: Setup involves adding a JavaScript snippet for Browser monitoring and configuring Synthetic scripts via the UI or API. Progressive activation of features helps manage complexity during rollout on complex platforms.
Website: https://newrelic.com
3. Dynatrace (Digital Experience Monitoring)
Dynatrace offers an enterprise-grade Digital Experience Monitoring (DEM) solution renowned for its powerful AI engine, Davis. It's particularly well-suited for organizations managing intricate DXP environments, such as Sitecore, that require deep, automated root cause analysis. The platform provides a full-stack view, combining Real User Monitoring (RUM) with advanced synthetic tests and session replay to deliver granular diagnostics from user interaction down to the code level.

The platform's strength lies in its ability to automatically map dependencies and pinpoint the precise cause of performance issues, whether it's a front-end JavaScript error, a slow API, or an underlying infrastructure problem. This AI-assisted analysis makes Dynatrace one of the most effective website performance monitoring tools for teams who need to reduce manual troubleshooting time. Its detailed journey analytics and session replays are invaluable when you need to audit your digital experience platform performance and understand user friction points.
Key Considerations
- Use Case: Identifying that a slow checkout process on a Sitecore-powered site is caused by a specific microservice, with Davis AI automatically flagging the issue and its business impact, even in a complex composable architecture.
- Pros: The AI-driven causation analysis (Davis) is a significant differentiator, providing actionable answers instead of just data. The consumption-based pricing model for DEM can be cost-effective for certain usage patterns.
- Cons: The depth and breadth of the platform introduce a learning curve, and it may be overly complex for smaller teams. Procurement is typically a sales-led process, which can be less direct than self-service options.
- Implementation: Requires deploying the OneAgent on your hosts and injecting a JavaScript tag for RUM. Configuration of alerts and dashboards is done through the Dynatrace UI, with strong automation capabilities.
Website: https://www.dynatrace.com
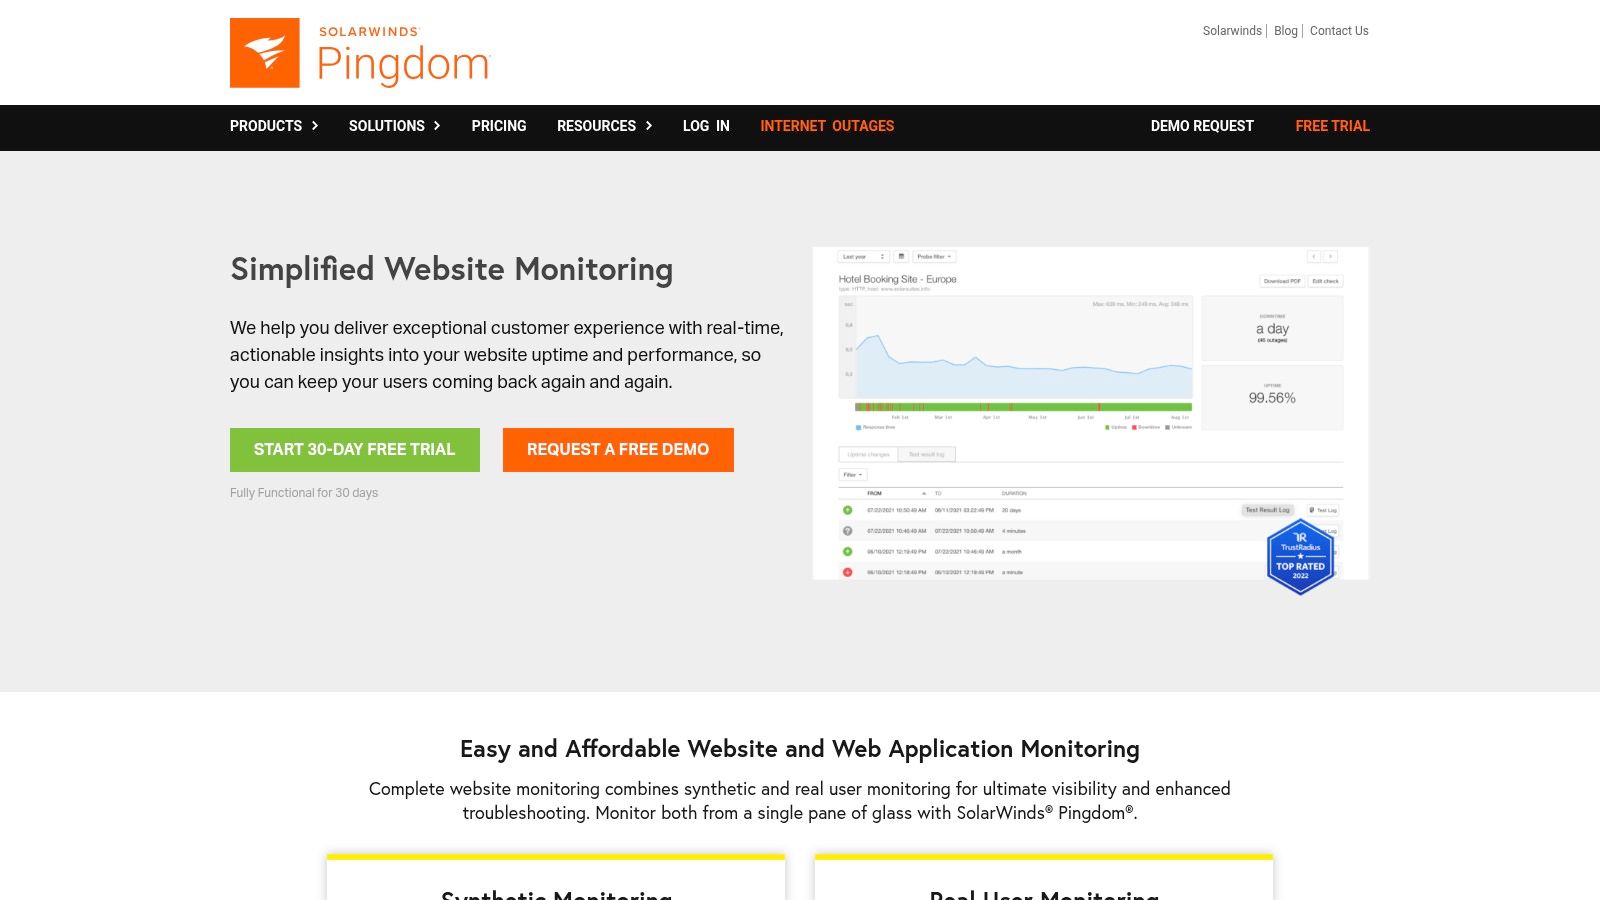
4. Pingdom (SolarWinds)
Pingdom offers a direct and approachable entry into website performance monitoring, making it a popular choice for marketing and engineering teams who need to establish baseline uptime and performance visibility quickly. It excels at providing immediate value through Synthetic Monitoring for availability and page speed, alongside foundational Real User Monitoring (RUM) to understand actual visitor experiences. Its simplicity is its strength, presenting clear, actionable data without the complexity of a full-stack observability suite.
The platform allows you to run uptime and page speed tests from over 100 global locations, ensuring your Sitecore or SharePoint site is accessible worldwide. You can also configure transaction monitoring to simulate critical user flows, like a login process or adding an item to a cart, to proactively catch issues. Pingdom's RUM provides insights into performance by browser, device, and geography, helping teams prioritize optimizations based on their specific audience. It's one of the most straightforward website performance monitoring tools to deploy.
Key Considerations
- Use Case: A marketing team wants 24/7 uptime alerting for a campaign landing page on their Sitecore DXP and a simple weekly report on page load times for key markets.
- Pros: The user interface is exceptionally clean and easy to navigate, allowing teams to get set up and receive alerts in minutes. It provides fast value for essential availability and basic performance metrics.
- Cons: Pingdom lacks the deep diagnostic capabilities of integrated APM solutions. For complex issues on platforms like Sitecore, you cannot trace a slow page load back to a specific code-level problem without other tools. Advanced enterprise features often require purchasing additional SolarWinds products.
- Implementation: Setup is very simple. Uptime and page speed checks only require a URL. Transaction monitoring uses a web-based recorder, and RUM is enabled by adding a small JavaScript snippet to your site's header.
Website: https://www.pingdom.com
5. SpeedCurve
SpeedCurve is a performance-focused platform that is purpose-built for front-end developers and user experience teams. It combines Synthetic Monitoring and Real User Monitoring (RUM) with an exceptional focus on Core Web Vitals (CWV) and the visual aspects of page loading. Its approach is favored by teams who want to establish performance budgets and receive alerts when regressions occur, making it a strong guardrail in a CI/CD pipeline.
The platform shines in its ability to provide clear visual diagnostics. Features like filmstrip comparisons and competitive benchmarking allow teams to see exactly how their site loads. By setting performance budgets, teams responsible for complex DXPs like Sitecore can ensure that new components or personalization rules do not negatively impact key metrics like Largest Contentful Paint (LCP). SpeedCurve is one of the essential website performance monitoring tools for organizations prioritizing front-end speed, a key tenet of Sitecore's philosophy.
Key Considerations
- Use Case: Ideal for a front-end team to diagnose a CWV regression on a Sitecore site, using filmstrips to pinpoint which visual element is causing the slowdown and setting a performance budget to prevent it from happening again.
- Pros: Its deep focus on Core Web Vitals and performance budgets is a major advantage for UX-centric teams. The clear and flexible plan builder and RUM sampling make cost management predictable.
- Cons: It is not a full-stack observability tool; it lacks deep APM or logging capabilities and should be paired with a back-end monitoring solution. Enterprise features like SSO or private agents are reserved for higher-tier plans.
- Implementation: Setup requires adding a JavaScript snippet for RUM and configuring synthetic tests through the UI. The platform offers strong API support for integrating performance checks directly into a deployment pipeline.
Website: https://www.speedcurve.com
6. Catchpoint (Internet Performance Monitoring)
Catchpoint offers an enterprise-grade platform that shifts the focus of performance monitoring from your internal infrastructure to the entire internet delivery chain. It is an excellent choice for large, global brands whose user experience is heavily dependent on external services like CDNs, DNS providers, and ISP networks. By providing deep visibility into these third-party dependencies, Catchpoint helps organizations proactively identify and resolve issues that originate outside their direct control, which is a common challenge for distributed DXP environments like those built with Sitecore's composable products.

The platform’s strength lies in its vast network of over 3,000 global monitoring agents, which allows for precise simulation of user experiences from virtually anywhere. Its combination of synthetic monitoring, which tests everything from browser and API performance to BGP and DNS health, with Real User Monitoring (RUM) provides a complete view of digital performance. This level of detail makes it one of the premier website performance monitoring tools for enterprises that cannot afford downtime caused by external network problems.
Key Considerations
- Use Case: Ideal for a global e-commerce brand running on a platform like Sitecore OrderCloud to diagnose why users in a specific country are experiencing slow load times, tracing the problem to a regional ISP peering issue or a misconfigured CDN node.
- Pros: Its most significant advantage is the unmatched visibility into the external internet stack. The enormous and reliable global agent network provides highly accurate and location-specific performance data.
- Cons: The platform's extensive capabilities come at a premium, making it a costly option that might be excessive for smaller websites or businesses with a purely local user base. The pricing model is designed for enterprise budgets.
- Implementation: Deployment typically involves configuring synthetic tests through its web-based UI and, for RUM, adding a JavaScript tag to your website’s pages. Enterprise features like SSO facilitate integration into existing corporate IT systems.
Website: https://www.catchpoint.com
7. Uptrends
Uptrends offers a focused suite of website performance monitoring tools, combining strong Synthetic Monitoring with Real User Monitoring (RUM). Its main appeal lies in its straightforward, credit-based pricing and an accessible interface, making it an excellent choice for teams who need powerful monitoring without the complexity of a full-stack observability platform. With over 230 global checkpoints, it provides extensive geographic coverage for testing website availability and performance.

The platform enables you to create multi-step transaction scripts to simulate complex user journeys, such as a checkout process on an e-commerce site built on Sitecore or an approval workflow in SharePoint. Its browser monitoring provides detailed filmstrips and resource waterfalls, helping pinpoint slow-loading assets. The RUM component captures actual user data, offering breakdowns by device, browser, and geography to understand real-world performance patterns. This combination makes it a solid option for marketing and digital teams who prioritize front-end experience.
Key Considerations
- Use Case: Ideal for a marketing team that needs to quickly set up uptime alerts and browser-based transaction monitoring for a campaign landing page without requiring deep back-end integration or developer support.
- Pros: The transparent, à-la-carte pricing model is a significant advantage, allowing you to pay only for the capabilities you use. The platform is easy to get started with and is approachable for mixed-skill teams.
- Cons: It is not a complete observability solution. To correlate a front-end slowdown with a back-end issue, you must integrate it with a separate APM or logging tool, as it lacks deep back-end visibility on its own.
- Implementation: Setup is typically fast. It involves configuring synthetic checks through a user-friendly UI or using the transaction recorder, and adding a small JavaScript snippet to your site for RUM data collection.
Website: https://www.uptrends.com
8. Site24x7 (by Zoho)
Site24x7, a Zoho company, offers an all-in-one monitoring solution that covers website performance, infrastructure, and application health. It's a practical choice for teams aiming to consolidate their tooling across web and IT operations, providing a single platform for synthetics, RUM, logs, APM, and server monitoring. This broad scope allows organizations to track everything from front-end user experience on a DXP like Sitecore to the underlying cloud infrastructure supporting it.

The platform provides proactive uptime checks and synthetic transaction monitoring to catch issues before they affect users. Its Real User Monitoring (RUM) component captures Core Web Vitals and offers tiered pageview plans, making it a scalable option for gathering real-world data. By combining these front-end metrics with back-end server, network, and application monitoring, Site24x7 stands out as one of the more expansive website performance monitoring tools for teams needing full-stack visibility.
Key Considerations
- Use Case: Excellent for an organization that needs to monitor a public-facing SharePoint portal's availability while also tracking the health of the on-premise servers or Azure VMs hosting it.
- Pros: The platform’s biggest strength is its transparent, add-on-based pricing, which simplifies scaling. Its broad coverage across the entire IT stack in a single product is a significant advantage for operational efficiency.
- Cons: The user interface can feel dense and overwhelming for new users due to the sheer number of features. Fully realizing the platform’s value may require a dedicated onboarding and training period.
- Implementation: Setup requires adding a JavaScript snippet for RUM and configuring synthetic tests and infrastructure agents through the web UI. Role-based access and SSO integrations are available for enterprise security.
Website: https://www.site24x7.com
9. Sematext (Synthetics + Experience/RUM)
Sematext offers a modular and approachable monitoring platform that combines front-end and back-end visibility. Its strength lies in its straightforward, low-entry pricing and simple setup, making it an excellent choice for teams that need powerful website performance monitoring tools without the complexity and cost of larger, all-in-one suites. The platform is divided into key products: Synthetics for proactive API and browser testing, and Experience (RUM) for capturing real user data.
This modularity allows teams managing platforms like Sitecore or SharePoint to start with essential front-end monitoring and scale into logs or infrastructure monitoring as needed. Sematext provides browser and API synthetic checks from multiple global locations, alongside real user monitoring that captures Core Web Vitals, session timings, and detailed device and geography breakdowns. Its predictable, metered billing is a significant advantage, as costs are based on usage rather than per-user seats.
Key Considerations
- Use Case: Ideal for a mid-sized marketing team that needs to quickly set up alerts for when their Sitecore homepage's Largest Contentful Paint (LCP) degrades in a specific region, without committing to a full APM suite.
- Pros: The platform is known for its fast onboarding and transparent, metered pricing that avoids per-seat charges. Having unlimited users and data sources on paid plans makes it highly cost-effective for growing teams.
- Cons: It has fewer of the deep, enterprise-specific features found in larger observability platforms and is not positioned as a complete, all-encompassing APM and log management solution out of the box.
- Implementation: Deployment is simple, requiring the addition of a small JavaScript snippet to your website for RUM (Experience). Synthetic tests are configured through a clean, intuitive UI.
Website: https://sematext.com
10. Akamai mPulse (Real User Monitoring)
Akamai mPulse is an enterprise-grade Real User Monitoring (RUM) platform that provides deep insights into the actual user experience by capturing real-time performance data. As it's built on the widely adopted Boomerang.js library and integrated directly into Akamai’s edge network, it offers a distinct advantage for organizations already using Akamai's CDN or other edge services. This close integration allows for immediate data collection at the edge, ensuring accuracy and providing strong, built-in data privacy and governance controls.

The platform is one of the most capable website performance monitoring tools for tracking and analyzing Core Web Vitals, including newer metrics like Interaction to Next Paint (INP). Its real-time dashboards and alerting capabilities enable teams to quickly identify and react to performance regressions affecting specific geographic regions, devices, or user segments. By analyzing this data, teams can pinpoint the root causes of poor performance and make informed optimizations, which is a key part of any comprehensive user experience audit checklist.
Key Considerations
- Use Case: Ideal for a global e-commerce brand running on a platform like Sitecore Commerce who already uses Akamai CDN. They can use mPulse to get precise Core Web Vitals data from actual customer sessions in different countries to prioritize front-end optimizations.
- Pros: It has been proven at a massive global scale, drawing on Akamai’s extensive network infrastructure. The platform offers powerful, actionable UX analytics with excellent support for all Core Web Vitals.
- Cons: It delivers maximum value when you are already within the Akamai ecosystem. Pricing is not publicly listed and is typically managed through enterprise sales contracts, which may not suit smaller teams.
- Implementation: Setup involves adding a JavaScript beacon to your website. For Akamai customers, this can often be injected automatically at the edge, simplifying deployment across large-scale sites like Sitecore XM Cloud or SharePoint instances.
Website: https://www.akamai.com/products/mpulse-real-user-monitoring
11. Calibre
Calibre is a developer-centric synthetic monitoring tool built to enforce performance standards throughout the development lifecycle. It stands out by making performance budgets a first-class citizen, allowing teams to set specific thresholds for metrics like Core Web Vitals and get immediate alerts when they are exceeded. This makes it a great choice for engineering teams that want to embed performance guardrails directly into their CI/CD pipelines and prevent regressions before they reach production.

The platform provides detailed synthetic tests from global locations, complete with filmstrip views and in-depth performance metric waterfalls. While it does not offer per-session RUM, it cleverly integrates with the Chrome User Experience Report (CrUX) to provide real-world Core Web Vitals data, offering a high-level view of actual user performance. This combination of proactive synthetic testing and high-level RUM makes it one of the more focused website performance monitoring tools for front-end teams.
Key Considerations
- Use Case: Ideal for a development team managing a complex Sitecore front-end to automatically fail a build in their CI/CD pipeline if a code change negatively impacts the Largest Contentful Paint (LCP) beyond a set budget.
- Pros: Its standout features are the excellent performance budgeting and CI/CD integration, which automate performance governance. The pricing model is clear and based on tests and seats, making it easy to adopt and scale.
- Cons: The tool is narrowly focused on web performance and lacks the broader APM or logging capabilities of unified platforms. Its RUM is based on aggregated CrUX data, not on individual user session capture, which limits deep-dive analysis into specific user problems.
- Implementation: Setup is straightforward, involving adding URLs to monitor through the UI and integrating with development tools via webhooks or its API to automate performance checks.
Website: https://calibreapp.com
12. Raygun (Real User Monitoring + Error/APM)
Raygun carves out a specific niche by tightly bundling Real User Monitoring (RUM) with its powerful error and crash reporting capabilities. This makes it an excellent choice for teams who want to directly connect front-end performance issues, like a slow-loading component on a Sitecore page, to specific code-level errors or application crashes. Its strength lies in providing a clear line of sight from real user impact back to the underlying application instability causing it.

The platform offers strong Core Web Vitals reporting, including P75 metrics, and allows for deep segmentation to analyze performance by user, browser, or geography. This granular data, combined with page-level performance trends and custom timings, gives developers the context they need. When a performance dip is detected, teams can immediately check the integrated error reporting to see if a new bug or deployment issue is the root cause, making it a valuable part of any suite of website performance monitoring tools.
Key Considerations
- Use Case: Identifying that a sudden spike in LCP for users on a specific browser is directly caused by a JavaScript error that only manifests in that environment on your Sitecore or SharePoint site.
- Pros: The integration of RUM with error and crash reporting is its primary advantage. The ability to drill down to individual user sessions to see their complete journey and associated errors provides immense diagnostic value.
- Cons: The pricing model is event-based and often requires purchasing product bundles. Teams must carefully evaluate plan entitlements to ensure they get the necessary RUM features without paying for parts of the platform they won't use.
- Implementation: Setup requires adding a JavaScript snippet to your website. For deeper insights, you can integrate their APM agent on your server, which is especially useful for diagnosing issues in the back-end services powering a Sitecore instance.
Website: https://raygun.com
Top 12 Website Performance Monitoring Tools — Feature Comparison
From Monitoring to Optimization: Your Path to a Faster DXP
Selecting from this extensive list of website performance monitoring tools is more than a technical exercise; it's a strategic business decision. We've explored a dozen powerful platforms, from the all-in-one observability of Datadog and New Relic to the specialized focus of SpeedCurve and Calibre. The right choice is not about finding the "best" tool in a vacuum, but about aligning a tool's strengths with your organization's specific DXP architecture, team skills, and business objectives.
For instance, a global enterprise running a complex, multi-site Sitecore AI instance will find immense value in Dynatrace's AI-powered root cause analysis, which can untangle dependencies across a composable stack. A public sector organization managing a large SharePoint deployment might prioritize Site24x7 for its cost-effective, all-in-one monitoring that covers infrastructure and user experience. The key takeaway is that visibility is the prerequisite for improvement. Without a clear picture of what your users are actually experiencing, any optimization effort is just a guess.
Key Considerations for Your DXP Monitoring Strategy
As you move forward, the path from raw data to a truly optimized digital experience platform requires a deliberate approach. Remember these core principles:
- Synthetics vs. RUM is not a choice; it's a partnership. Synthetic monitoring, like that offered by Pingdom or Uptrends, gives you a controlled, 24/7 baseline of your DXP's health. Real User Monitoring (RUM) from tools like Akamai mPulse or Raygun tells you the real-world story of performance across countless device, network, and location variables. An effective strategy uses both to get the full picture.
- Integrations are non-negotiable for enterprise DXPs. Your performance data must flow seamlessly into your workflows. Consider how a tool integrates with your Sitecore or SharePoint environment, your cloud provider (Azure, AWS), and your team's communication platforms like Slack or Microsoft Teams. A tool that creates data silos is a hindrance, not a help.
- Performance is a feature, not just an IT metric. The insights from these tools are not just for developers and operations teams. They are critical for marketing and e-commerce managers. Slow load times on a new campaign landing page, checkout errors identified by Catchpoint, or poor Core Web Vitals reported by SpeedCurve directly impact conversion rates, user satisfaction, and brand perception.
Making Your Selection and Taking Action
To turn this guide into action, begin by creating a shortlist based on your primary DXP. If you are deeply invested in Sitecore's composable architecture and its AI capabilities, tools with strong APM and distributed tracing like New Relic, Datadog, or Dynatrace are excellent starting points. For SharePoint-centric organizations, a solution that provides deep insights into Microsoft stack dependencies is vital.
Once you have a shortlist, run a pilot program. Most of these providers offer trials. Install their agents on a staging environment and a small segment of your production traffic. This is the only true way to assess a tool's real-world value, its ease of use, and the quality of its support.
Finally, remember that technical performance is one pillar of a successful digital presence. To ensure your optimized DXP is found by your target audience, you also need a strong search visibility strategy. Choosing the best SEO company can be a critical investment in your company's digital visibility and growth, working in concert with your technical performance efforts. The ultimate goal is a fast, reliable, and discoverable digital experience that drives business results.
Ready to translate performance data into a competitive advantage for your Sitecore or SharePoint DXP? The experts at Kogifi use these exact website performance monitoring tools to audit, manage, and continuously optimize enterprise-grade digital platforms. Contact Kogifi today to see how our deep expertise can help you build and maintain a world-class digital experience.