


Many teams get bounce rate vs. exit rate wrong because they treat both as proof that a page “failed.” That's lazy analysis. A confirmation page can deserve a high exit rate, while a landing page can hide a serious message mismatch behind a harmless-looking exit number, and the distinction matters even more on Sitecore XM Cloud, AEM SPAs, and Next.js front ends where the architecture changes what the numbers mean.
If you're running enterprise analytics across a DXP estate, the question isn't whether a page lost visitors. It's where in the journey they left, what kind of page it was, and whether your tagging stack even captured the behavior cleanly. That's why bounce rate is an entry-page signal and exit rate is a journey signal, not two flavors of the same thing.
| Criterion | Bounce Rate | Exit Rate |
|---|---|---|
| Core question | Did the visitor leave after landing on this page? | Did this page end the session? |
| Scope | Single-page sessions that start on the page | All pageviews of the page |
| Best use | Landing pages, homepages, campaign pages | Checkout steps, content hubs, forms, internal flows |
| Common trap | Treating it as a universal quality score | Treating every exit as a problem |
| What it can hide | A landing page can look “fine” while failing to engage | A page can look “bad” while functioning as a valid endpoint |
Table of Contents
- Sitecore landing pages and campaign traffic
- Checkout or content finder steps
- SharePoint intranet forms and internal tasks
- Acquisition experiments need bounce logic
- Journey experiments need exit logic
- Personalization needs clean measurement
Why Bounce Rate and Exit Rate Are Not the Same Thing
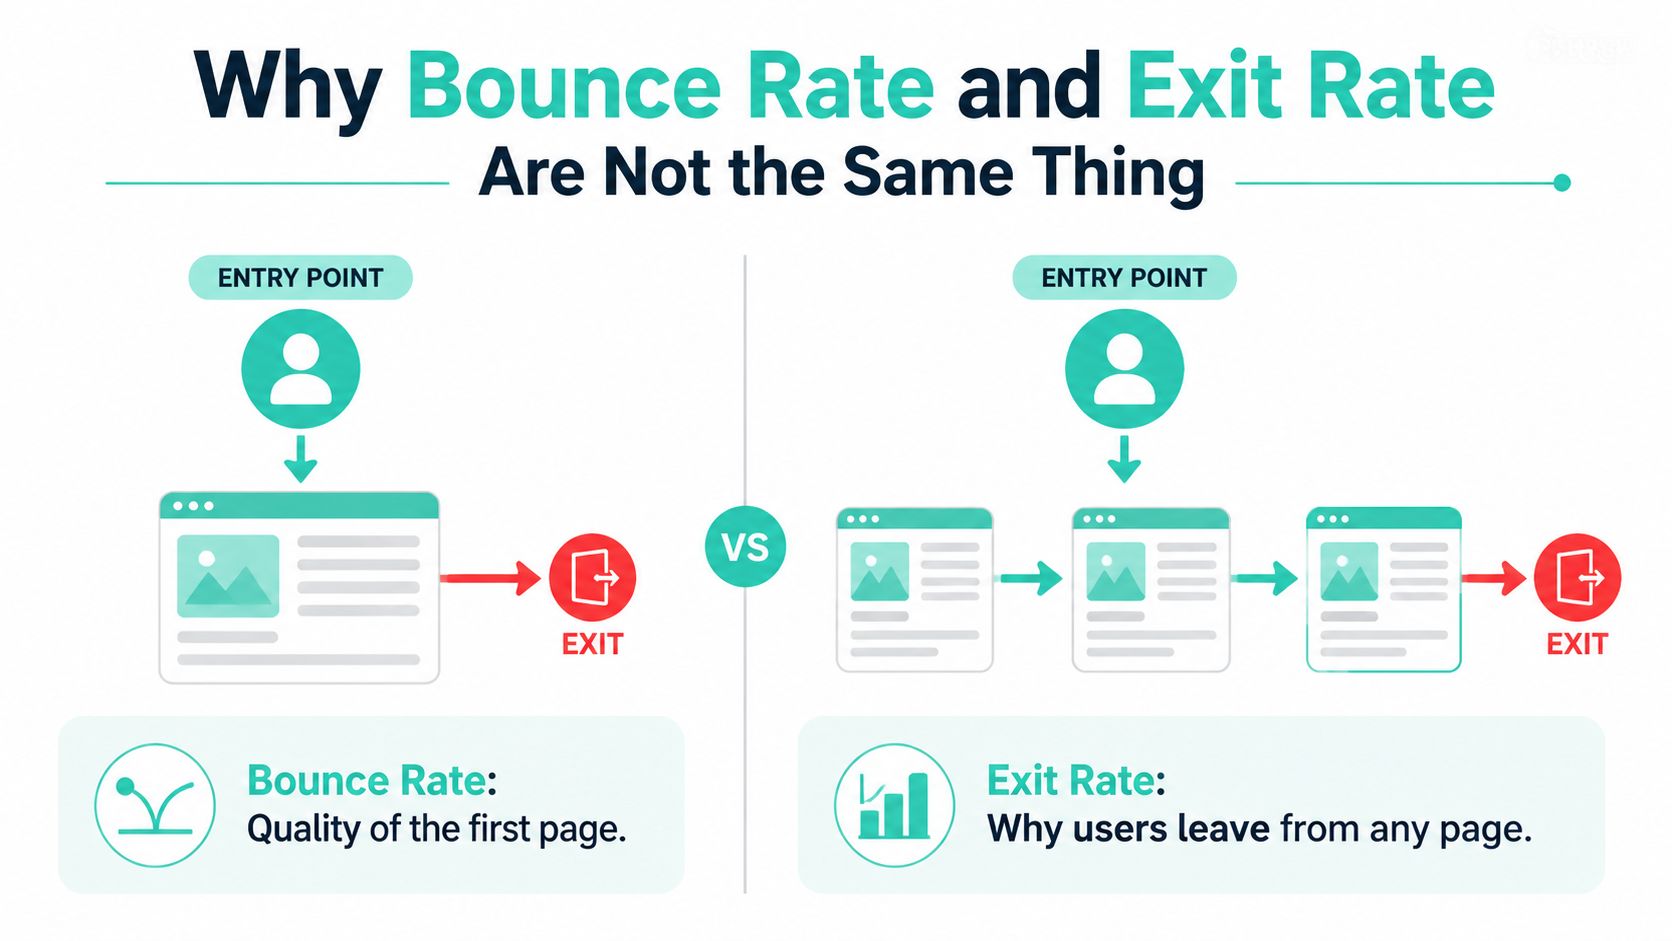
Enterprise reporting breaks down fast when bounce rate and exit rate get treated as the same signal. They answer different questions, and they come from different populations. One measures what happens when a session starts on a page and ends there. The other measures how often a page is the last pageview in any session. That separation matters on Sitecore XM Cloud, AEM SPAs, and Next.js headless front ends, because page role and interaction model change what the metric is telling you.
Entry quality versus journey end
A bounce starts and ends on the same page. That makes bounce rate a check on first contact, not a broad site-health score. If someone lands on a campaign page and leaves without moving deeper, the problem is usually acquisition quality, page relevance, or a weak handoff into the rest of the experience.
Exit rate works differently. A page can be the final step after a useful journey, which is why a high exit rate often points to a page that is doing its job. A thank-you page is the cleanest example, since it can close a session and still be healthy.
Practical rule: judge bounce rate on pages you send traffic to, and judge exit rate on pages people pass through on the way to a goal.
That is why a high bounce rate on a homepage deserves more attention than a high exit rate on a confirmation page. On an enterprise DXP, those pages play different roles, so they need different interpretations. A Sitecore analytics audit should preserve that distinction instead of flattening it into one catch-all view.
For teams that want a broader content-marketing lens, this metrics for content marketing guide is a useful companion, but the same rule still applies, page role determines which metric matters more.
Why the confusion persists
The confusion lasts because both metrics sit close together in dashboards and both describe departure behavior. That surface similarity causes bad reads. A page can post a low bounce rate and still be a poor step in the journey, or it can show a high exit rate and still be the right place for a session to end. If you read the tiles without page context, you will fix the wrong thing.
The Formulas Behind Each Metric
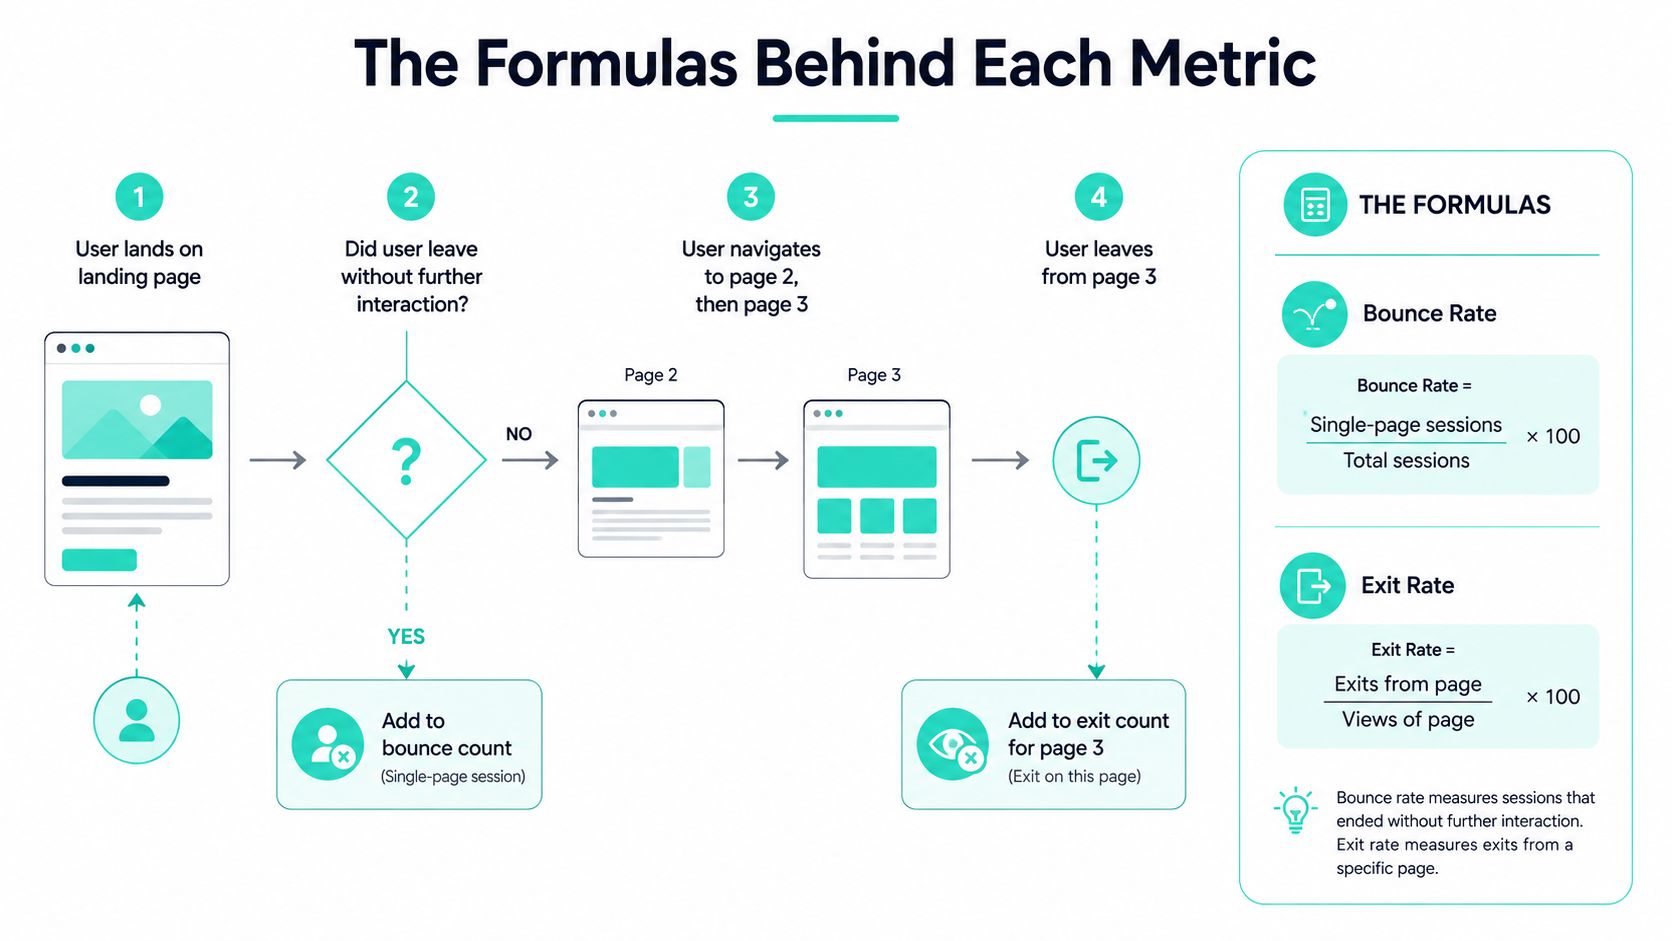
The formulas are simple, but they are simple in different ways. Bounce rate uses sessions starting on the page as the denominator. Exit rate uses all pageviews of the page as the denominator. That difference matters because the same page can look very different depending on which number you pull, especially on enterprise sites where a page can serve more than one role.
A worked session you can reproduce
Take three sessions:
- Session A, Homepage → Product page → Pricing page → Leaves
- Session B, Pricing page → Leaves
- Session C, Blog post → Pricing page → Sign-up page → Leaves
Now isolate the pricing page.
- It was the entry page only in Session B.
- It was viewed in all three sessions.
- It was the last page only in Session A.
If Session B was a single-page visit, the pricing page's bounce rate is based on that one entrance session. Its exit rate is based on how often the pricing page was the final pageview across all pricing-page views. That is the clean way to sanity-check any dashboard tile, regardless of vendor skin or report naming.
Why GA4 changes the interpretation
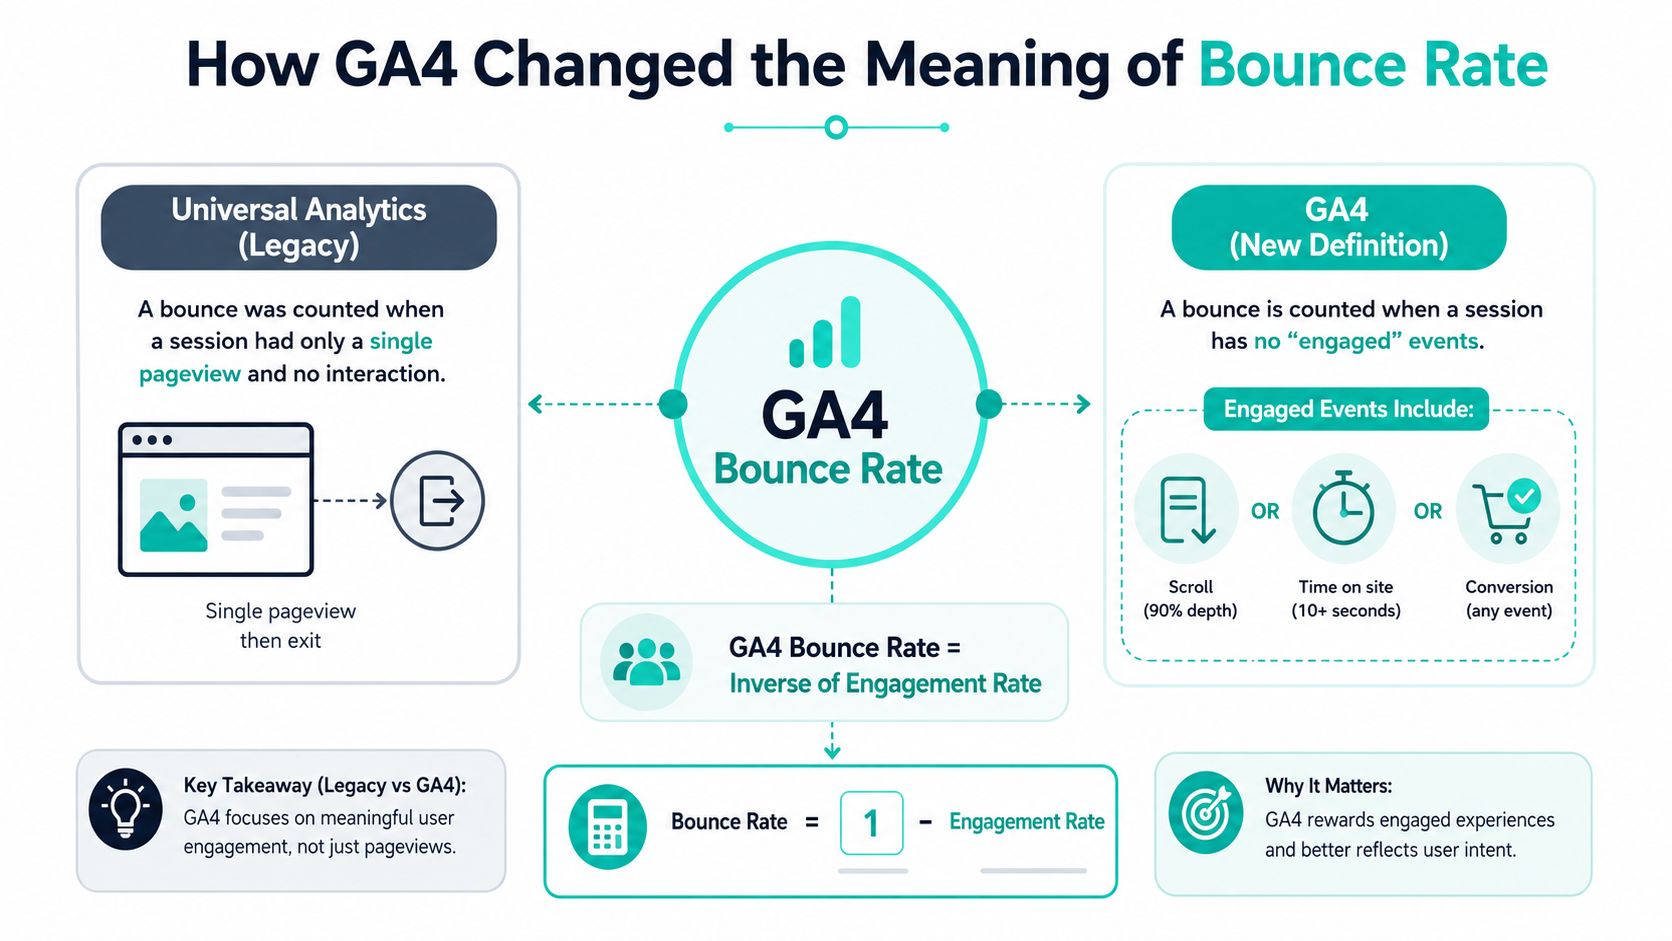
In GA4, bounce rate no longer means the old single-page-session metric. Google now treats it as the inverse of engagement, so a session counts as engaged if it lasts longer than 10 seconds, includes a key event, or includes 2 or more page views. That means one-page visits can avoid a bounce if they cross the engagement threshold. Old Universal Analytics habits can misread GA4 reports, especially when teams expect bounce rate to behave the same way it did before. GA4 bounce-rate definition shift
The safest check is to trace the metric back to its denominator before you trust the tile. If the page is a landing page, check the landing-session logic. If the page is a flow step, check whether you need exits, not bounces.
For event setup details, the event tracking in Google Analytics guide is the right operational reference.
If you can't state the denominator in one sentence, you don't really know what the dashboard is showing.
Side-by-Side Criteria That Separate the Two Metrics
| Criterion | Bounce Rate | Exit Rate |
|---|---|---|
| Calculation | Single-page sessions on the page divided by sessions starting on that page | Exits from the page divided by pageviews of that page |
| Scope | Entry pages only | Every pageview of the page |
| Sensitivity | Sensitive to first impression, traffic match, and landing-page relevance | Sensitive to friction, dead ends, and completion points in a journey |
| A high value often means | The page did not earn a second interaction | The page ended the session often, either naturally or because something blocked progress |
| Best diagnostic use | Campaign landing pages, homepages, content entry points | Checkout steps, filters, forms, portals, navigation bottlenecks |
| Main trap | Reading it as a general site-health metric | Treating a valid endpoint as a problem page |
What the table means in practice
Bounce rate is the better signal for landing-page quality. If a page exists to win a first click, a first form fill, or a first scroll, bounce rate shows whether the entrance worked. Paid media teams, content editors, and homepage owners usually need that read first because their main problem is often whether the page matched the promise that brought the visitor there.
Exit rate is better for diagnosing abandonment inside a journey. On a multi-step flow, the page that loses people is not always the entry point. It is often the step with unclear copy, hidden requirements, broken validation, or a missing next action. That is the metric I trust when the question is where the journey broke, not whether the first page attracted the right traffic.
A high exit rate is not automatically bad. A confirmation page, a “request received” page, or a finished task in SharePoint can end the session on purpose. The analytics mistake is reacting to the number before checking what role the page plays in the architecture.
Why benchmarking gets messy
Legacy benchmark references are useful only as a rough sanity check. Industry medians can vary a lot, and typical exit rates are often kept lower than bounce rates. That does not mean every enterprise should chase the same target. It does mean bounce rate usually reacts more strongly to first impressions than exit rate does.
On a Sitecore estate, I trust bounce rate more on acquisition landing pages and exit rate more on task paths, especially when content, personalization, and navigation all interact. On a SharePoint intranet, the same logic applies, but the “journey” might be a policy lookup, a form submission, or a document handoff rather than a purchase funnel. For teams that want to validate those flows properly, event tracking in Google Analytics helps confirm whether the page really failed or whether the user completed the intended action.
How GA4 Changed the Meaning of Bounce Rate
GA4 changed bounce rate in a way that catches a lot of teams off guard during migration. Universal Analytics treated bounce rate as the share of single-page sessions. GA4 ties it to engagement, so the number no longer means “left after one page view.” A user can view one page and still avoid a bounce if the session meets the engaged-session rules. The GA4 bounce-rate definition shift is a real reporting change, not a cosmetic one.
What changed in the report logic
GA4 counts a session as engaged when it lasts longer than 10 seconds, includes a key event, or includes 2 or more page views. That breaks the old shortcut where one page view automatically meant a bounce. The practical result is that some pages look healthier in GA4 because the definition is less strict about page count and more tied to interaction quality.
That shift matters during migration on enterprise DXPs. If a Sitecore team compares Universal Analytics bounce rate with GA4 bounce rate without resetting expectations, the trend line can look broken even when user behavior stayed the same. The metric changed first, so the benchmark has to change with it.
How to keep historical reporting honest
The safest approach is to stop treating GA4 bounce rate and UA bounce rate as equivalent. They are not. Use GA4 bounce rate as an inverse engagement indicator, then check exit rate and the event stream on the page to understand what happened.
Event governance matters here. If a page has meaningful interactions but the tags do not fire, GA4 can still classify the session as unengaged. For teams that need a clean event model before they trust the report, event tracking in Google Analytics is the place to tighten the instrumentation.
GA4 did not make bounce rate useless. It made bounce rate more dependent on measurement quality. That is a better fit for modern analytics, but only when the event setup reflects how people use the page.
Real Scenarios on Sitecore, AEM, and SharePoint
A landing page on Sitecore XM Cloud is where bounce rate earns its keep. If paid traffic lands on a hero page and people leave immediately, the problem is usually message mismatch, weak above-the-fold clarity, or a creative promise that the page doesn't fulfill. Bounce rate is the signal that tells you the first impression missed.
Sitecore landing pages and campaign traffic
On a Sitecore campaign page, I care about bounce rate first because the page is acting as an entrance gate. If the audience came from a paid ad or an email and didn't continue, the page didn't persuade them to take the next step. That's a classic acquisition-page diagnosis, and it fits the metric perfectly.
Checkout or content finder steps
In a multi-step checkout or product finder, exit rate becomes the sharper tool. The user already made progress, so a bounce doesn't tell you much. What matters is which step becomes the final page before abandonment, especially when the step includes pricing, selection logic, or a form field that's harder than the rest.
Practical rule: use exit rate on any page where the user has already invested effort and you need to know where the flow breaks.
SharePoint intranet forms and internal tasks
On a SharePoint intranet, exit rate often exposes permission friction, search friction, or form friction. If employees reach a policy page, a leave request, or a document upload flow and then leave, the page may be blocking their task rather than failing as an entry point. Bounce rate is less useful there unless the page is also used as a search landing page.
That's why I look at page role before I look at the metric. A homepage, a campaign page, a form step, and a knowledge-base article do not deserve the same interpretation. A Sitecore personalisation page, an AEM product step, and a SharePoint task screen all tell different stories, even if the dashboard colors make them look similar.
Measurement Pitfalls on Headless and SPA Architectures
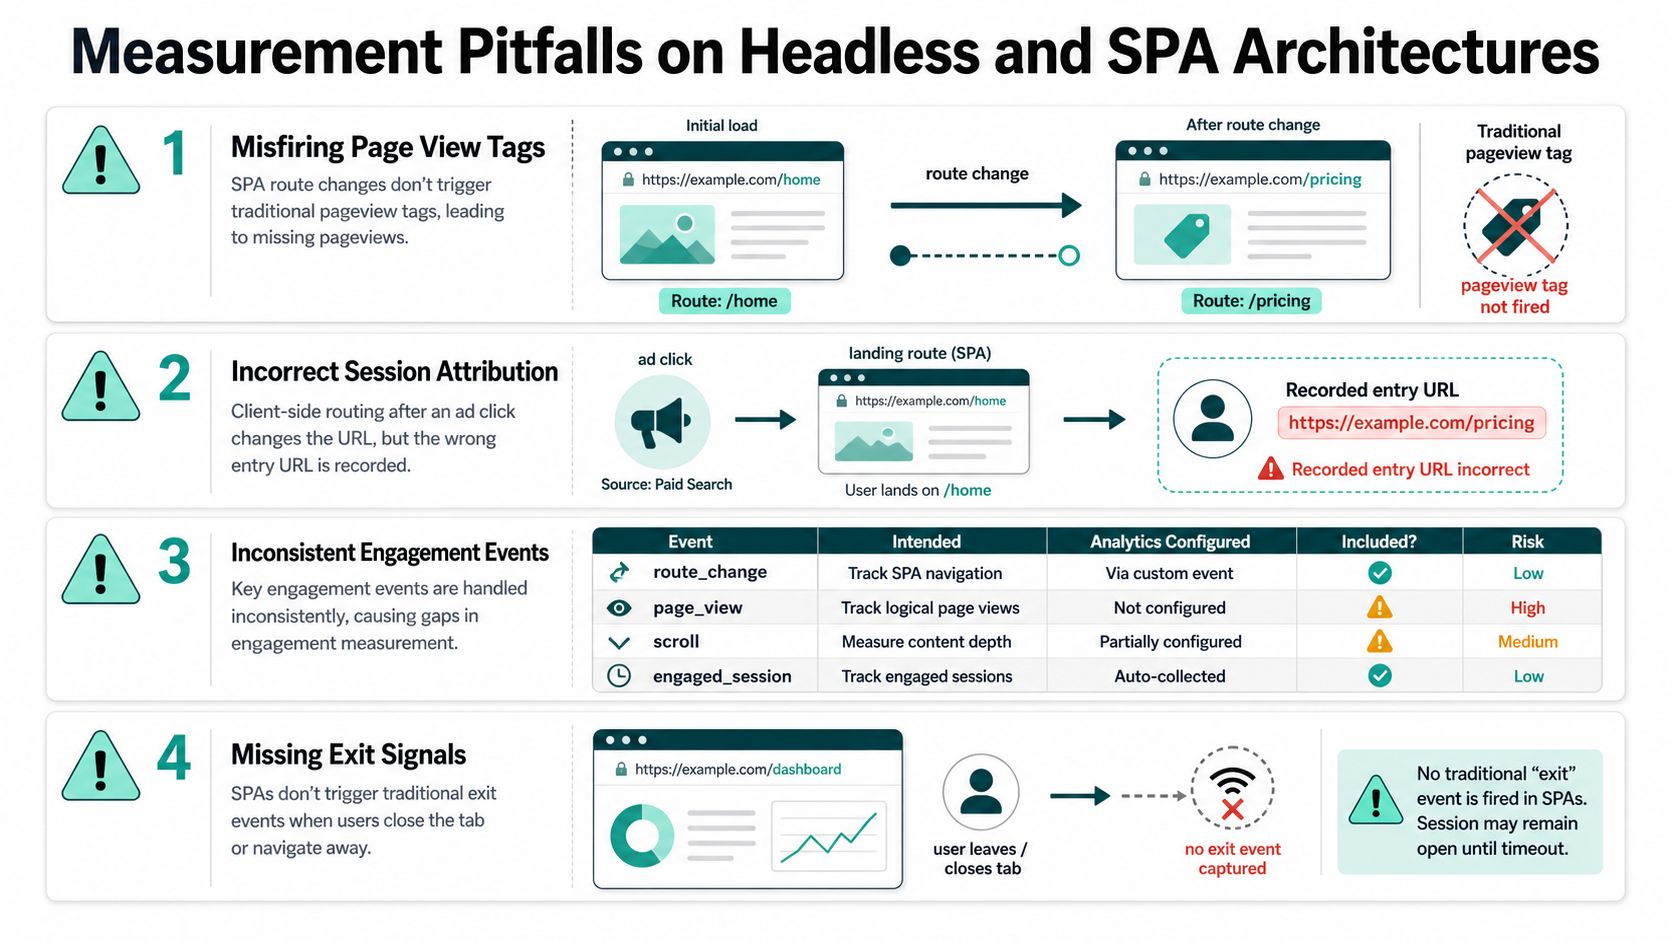
Headless and SPA front ends break lazy analytics assumptions fast. On Sitecore XM Cloud, Next.js, or an AEM single-page app, the browser can move from route to route without a full reload, while the tag stack still depends on clean page-load logic. That gap is where bounce and exit numbers drift away from actual behavior.
Where the signal breaks
The first problem is misfiring page view tags. If client-side route changes do not trigger a page_view event, the analytics platform never records the new page. The second problem is incorrect session attribution, where the session appears to begin on the wrong URL because routing happened in the browser before the measurement layer caught up.
The third problem is inconsistent engagement events. If one route change fires a custom event and another does not, GA4 can classify similar visits in different ways. The fourth problem is missing exit signals, which is common in SPAs because the user can close a tab without a clean end-of-session marker.
The most common failure is not the metric itself. It is the architecture underneath it.
What to fix first
Start with the route model and the event model, then tighten governance around them.
- Fire page_view on client-side route changes: Make sure SPA navigation is tracked as page movement, not just as internal state changes.
- Standardize engagement events: Use the same event names and triggers across templates so GA4 engagement logic is not distorted.
- Configure cross-domain linking: Preserve session continuity when journeys move between related domains or subdomains.
- Validate consent-mode behavior: Confirm that consent settings do not suppress the events needed for page and exit interpretation.
- Use server-side collection where client tags are unstable: A server-side tracking setup can help when browser-side tags are blocked, inconsistent, or fragile across devices and consent states.
For teams stabilizing measurement across a headless stack, route integrity matters more than vanity dashboard consistency. If the page view, engagement, and exit events do not line up with the actual journey, bounce rate and exit rate stop being diagnostic and start becoming noise.
Connecting the Metrics to A/B Testing and Personalization
Testing programs fall apart when they use the wrong metric for the page role. If you optimize a Sitecore landing page using exit rate, you may ignore the actual first-impression problem. If you optimize a checkout step using bounce rate, you may miss the point where the journey breaks. Metric choice has to follow the architecture, not the convenience of the dashboard.
Acquisition experiments need bounce logic
For acquisition pages, personalized hero content, and campaign landers, bounce rate is the cleaner signal. Those pages live or die on whether visitors continue after the first impression. If the ad, email, or search promise doesn't match the content, bounce rate tells you that the variant failed to earn attention.
Journey experiments need exit logic
Inside a journey, exit rate is usually the more honest signal. Variant A can look fine if users click into the flow, but if they still leave on step 2, the journey hasn't improved. That applies to forms, finders, checkouts, and internal service flows on Sitecore and AEM.
For teams using an experimentation platform, the question is not whether a variant “won” globally. It's whether the variant improved the metric that matches the page's role. Experimentation platform guidance should be built around that rule, not around whatever metric the tool surfaces by default.
Personalization needs clean measurement
Personalization only works when the event model is trustworthy. If a hero banner changes but the route tracking is broken, you'll misread the result. If a search or recommendation module keeps people on the page longer, bounce rate may improve while exit rate stays flat, which can still be useful depending on the page's purpose.
Kogifi's enterprise delivery teams also use GA4 engagement event auditing and landing-page reporting by source and device when they stabilize analytics for Sitecore and related estates. That kind of audit keeps the experiment team and the analytics team from arguing past each other.
Action Plan and Common Questions for Digital Experience Teams
Start with the page role, then choose the metric. Use bounce rate for entry points, exit rate for flow steps, and GA4 engagement for the new baseline on modern estates. Then audit your tagging, because a broken route model makes every other decision suspect.
- Tagging hygiene: Verify page_view firing on every client-side route, confirm cross-domain continuity, and make sure consent rules don't suppress key events.
- Dashboard design: Label landing pages, flow pages, and confirmation pages differently so people don't compare unlike numbers.
- Experimentation alignment: Pick success metrics based on page role, not on what's easiest to report.
- Partner selection: Ask whether the team can audit GA4 events, stabilize SPA tracking, and explain how Sitecore, SharePoint, or AEM page roles change metric choice.
Q: Can I compare Universal Analytics bounce rate with GA4 bounce rate directly?
No. GA4 uses engagement logic, so the numbers won't line up cleanly. Treat the GA4 version as a new metric, not a simple continuation.
Q: When is exit rate more useful than bounce rate?
Use exit rate when the user has already moved through a journey and you need to find the step where abandonment happens.
Q: What should I ask a Sitecore partner in a measurement audit?
Ask how they track client-side routing, how they define engagement events, and how they separate landing-page reporting from flow reporting.
If your team is cleaning up bounce rate vs. exit rate reporting on Sitecore, AEM, or SharePoint, Kogifi can help audit the tagging, fix SPA measurement gaps, and align dashboards with real page roles. Visit Kogifi to discuss analytics stabilization, experimentation setup, and DXP measurement support for your estate.