

Your Sitecore platform can look healthy while customers are having a bad experience.
That happens all the time after a launch. Traffic rises. Infrastructure dashboards stay green. Synthetic tests say the homepage loads fine. Meanwhile, users in one region hit slow pages, Safari users struggle with a script-heavy checkout, or a new personalization rule adds just enough delay to flatten conversion. Marketing sees the outcome. Engineering sees no obvious incident. Leadership gets stuck between two incomplete stories.
That visibility gap is where real user monitoring earns its place.
For enterprise DXPs, especially Sitecore and SharePoint estates with personalization, third-party integrations, server-side rendering, and composable services, lab data isn't enough. You need to know what people actually experienced on real devices, across real networks, in real sessions. RUM gives you that field-level truth and, more importantly, it gives you something a CTO can act on: evidence you can segment, correlate, and prioritize.
In Sitecore environments, that matters even more when AI-driven experiences enter the picture. Personalization logic, search, recommendations, analytics scripts, consent layers, and commerce calls all shape perceived performance. If you can't see the session-level outcome, you're optimizing architecture in the dark.
Table of Contents
- Introduction Seeing Your DXP Through Your Users' Eyes
- What the browser actually reports
- Why this matters in enterprise DXPs
- Sitecore XP and XM Cloud need different instrumentation habits
- Correlate browser sessions with backend work
- SharePoint needs the same discipline
Introduction Seeing Your DXP Through Your Users' Eyes
A familiar enterprise pattern goes like this. The campaign is live, the Sitecore stack is stable, and every internal report says the rollout was clean. Then the commercial team starts asking why engagement feels softer than expected. Nobody has a reliable answer.
The problem usually isn't a total outage. It's a degraded experience that only affects part of the audience. A browser-specific script issue. A regional latency spike. A personalization component that behaves well in test but drags in production. Standard platform monitoring often misses these because it focuses on server health, not the lived experience of the user session.
That distinction matters for Sitecore, SharePoint, and other enterprise DXPs. These platforms are designed to assemble experiences dynamically. They pull in content, search, identity, analytics, media, and often AI-driven components. Every additional dependency creates another point where the customer journey can slow down or fail without triggering a classic infrastructure alert.
Real performance is what the visitor felt, not what the server intended to deliver.
A CTO doesn't need another dashboard filled with isolated technical metrics. The useful question is simpler: where are users struggling, who is affected, and which part of the stack caused it?
Real user monitoring answers that with production evidence instead of assumptions. It exposes the actual browser session, the conditions around it, and the moments where performance or stability breaks down. In a DXP context, that's the difference between guessing at experience problems and tracing them to a component, integration, or content decision you can fix.
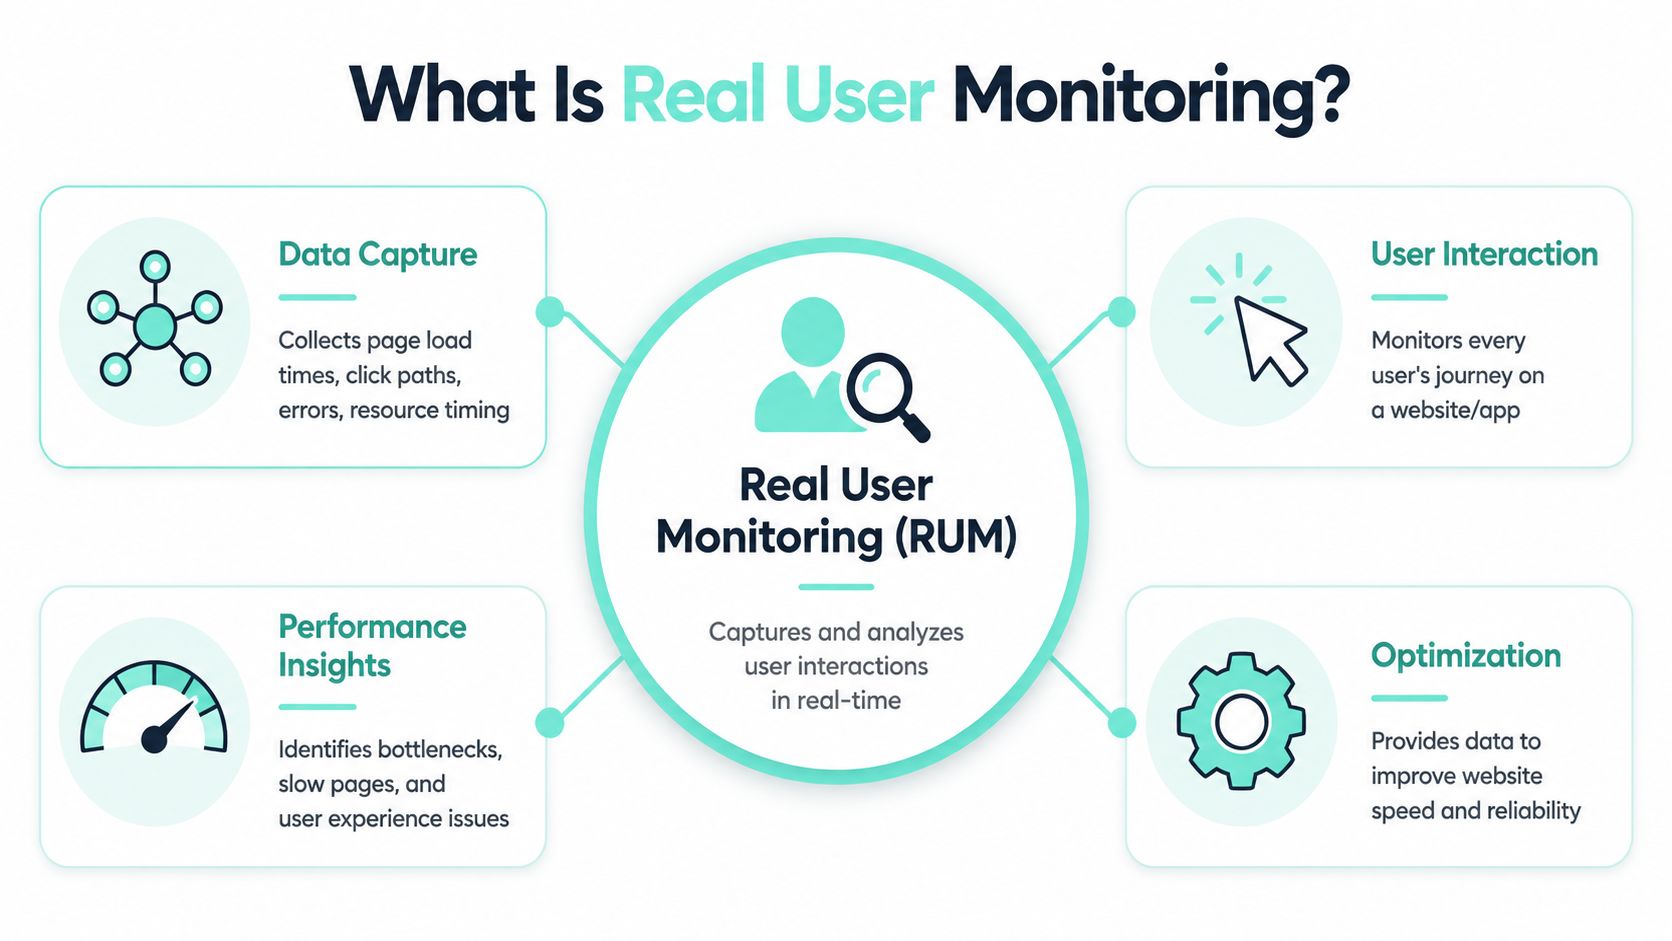
What Is Real User Monitoring and How Does It Work
Real user monitoring became a formalized, production-focused observability practice as modern web apps moved beyond simple page-load tracking toward full session visibility. It collects data from actual users through embedded scripts, capturing browser events, load actions, network requests, JavaScript errors, and Core Web Vitals such as LCP, INP, and CLS. That lets teams analyze real sessions across devices, browsers, geographies, and network conditions instead of relying only on synthetic tests, and it is now used to correlate frontend experience with outcomes like conversions and bounce rate on large digital properties, as described in Embrace's overview of real user monitoring.
A simple way to think about it is this: synthetic testing checks whether the road should be drivable. RUM shows how people drove it.
What the browser actually reports
In practice, a lightweight tag or agent runs in the browser and listens passively. It doesn't simulate activity. It records what happened during the actual visit.
That usually includes:
- Loading behavior such as page-load sequencing, asset timing, and delayed render events
- Client-side failure signals like JavaScript errors and failed network requests
- User interaction data including clicks, taps, and navigation paths
- Experience metrics such as LCP, INP, and CLS from live traffic
For a Sitecore site, real user monitoring quickly becomes useful. You can see whether a rendering-heavy page type performs differently from a simpler template. You can compare authenticated and anonymous journeys. You can isolate issues tied to campaign landing pages instead of averaging them into the entire estate.
Later in the session, video helps frame the concept from another angle:
Why this matters in enterprise DXPs
What works in production is rarely what looked perfect in a lab. Enterprise DXPs have more moving parts than standalone marketing sites. Sitecore search, analytics, personalization rules, consent tooling, DAM integrations, forms, and commerce services all shape what the browser experiences.
RUM gives you evidence at the session level. That changes how teams troubleshoot. Instead of saying "the site seems slow," you can say "this route degrades on a specific device and network mix after a consent script loads, and users abandon at the next interaction."
Practical rule: If your architecture is dynamic, your monitoring has to observe dynamic sessions, not only controlled tests.
RUM vs Synthetic Monitoring The Lab and The Real World
The cleanest way to explain the difference is to stop treating them as substitutes.
Synthetic monitoring is controlled. You define the path, location, and cadence. It tells you whether a known user journey is available and whether baseline performance has drifted. That's useful for uptime, release validation, and proactive alerting.
RUM is passive. It reflects the actual device, browser, and network conditions of real sessions through lightweight frontend instrumentation rather than a controlled test path, which is what makes it materially different from synthetic checks, as outlined in Glassbox's guide to real user monitoring.
They answer different questions
Synthetic monitoring answers: is the system up, and does a scripted path still work?
RUM answers: what did customers really experience, and where did they struggle?
For a Sitecore estate, both matter. Synthetic checks should cover critical journeys such as homepage availability, login, search, and core forms. But synthetic tests won't expose every issue introduced by personalization logic, browser quirks, third-party tags, or real-world network variability. That's where RUM becomes decisive.
If uptime is part of your current monitoring conversation, website uptime monitoring fits alongside RUM rather than replacing it.
RUM vs Synthetic Monitoring At a Glance
| Aspect | Real User Monitoring (RUM) | Synthetic Monitoring |
|---|---|---|
| Data source | Actual user sessions | Scripted transactions |
| Environment | Real devices, browsers, networks, and locations | Controlled test conditions |
| Primary use | Understand lived user experience | Validate availability and baseline paths |
| Best for | Segmentation, session analysis, business impact | Proactive alerting, repeatable checks, pre-release validation |
| Blind spot | Doesn't see periods with no traffic | Misses problems outside scripted paths |
A common mistake is asking one tool to do both jobs. That creates blind spots on either side. Teams either over-trust synthetic results, or they collect rich RUM data with no dependable proactive test coverage.
For a CTO, the decision isn't RUM or synthetic. It's whether the organization can afford to run a complex DXP without both lab evidence and field evidence.
Key RUM Metrics That Drive Business Outcomes
RUM generates a lot of telemetry. Most of it isn't useful in board-level or steering-group discussions. The metrics that matter are the ones you can tie to user friction, abandonment, or progression through a key journey.
A major milestone for RUM was Google's standardization of Core Web Vitals, which pushed field data into the mainstream. RUM tools now commonly track LCP, INP, and CLS from live traffic, capturing how pages perform on real devices and networks, as described in New Relic's explanation of real user monitoring.
Start with experience metrics
LCP tells you when the main visible content becomes available. On a Sitecore landing page, that often reflects the cost of hero media, personalization fragments, and render sequencing. If LCP is weak on campaign pages, users feel the delay before they read a word.
INP reflects responsiveness. In practice, heavy client-side processing, delayed event handlers, and third-party scripts start to hurt. If users tap filters, open navigation, or submit a form and the interface feels sluggish, INP usually helps expose it.
CLS measures visual stability. On content-rich DXPs, layout shifts often come from late-loading banners, embedded components, consent layers, or personalization blocks. Users don't describe this as "CLS." They describe it as a site that feels broken.
Then map them to behavior
Once those experience metrics are visible, the next step is correlation. Don't stop at averages. Segment by page type, audience, browser family, country, login state, and key journey stage.
Useful pairings include:
- Landing page LCP with bounce behavior on paid traffic destinations
- INP with form completion on lead-generation flows
- CLS with product or content interaction where users need confidence to proceed
- JavaScript errors with abandonment on checkout, account, or search journeys
For teams trying to improve web app growth with analytics, performance data thereby becomes commercially meaningful rather than operationally interesting.
A practical reporting model works better than a long metric catalog:
| Metric | What it tells you | Business implication |
|---|---|---|
| LCP | When primary content becomes visible | First impression and engagement quality |
| INP | How responsive the interface feels | Friction during interaction-heavy journeys |
| CLS | Whether the layout stays stable | Trust and usability during browsing or conversion |
| Errors and failed requests | Where the session breaks | Drop-off points and support burden |
You should also align RUM with a broader optimization discipline. A structured approach to website performance optimization works far better when field data tells you which improvements affect real journeys, not just benchmark pages.
The right metric isn't the one that's easy to report. It's the one that explains why users stopped moving forward.
Why RUM Is Non-Negotiable for Sitecore and Modern DXPs
Sitecore gives enterprises the tools to build advanced experiences. That's the strength of the platform, but it's also where operational blindness starts. Personalization, testing, composable services, search, analytics, headless delivery, and AI-assisted content or recommendation layers all introduce moving parts that can degrade experience in ways standard health checks won't catch.
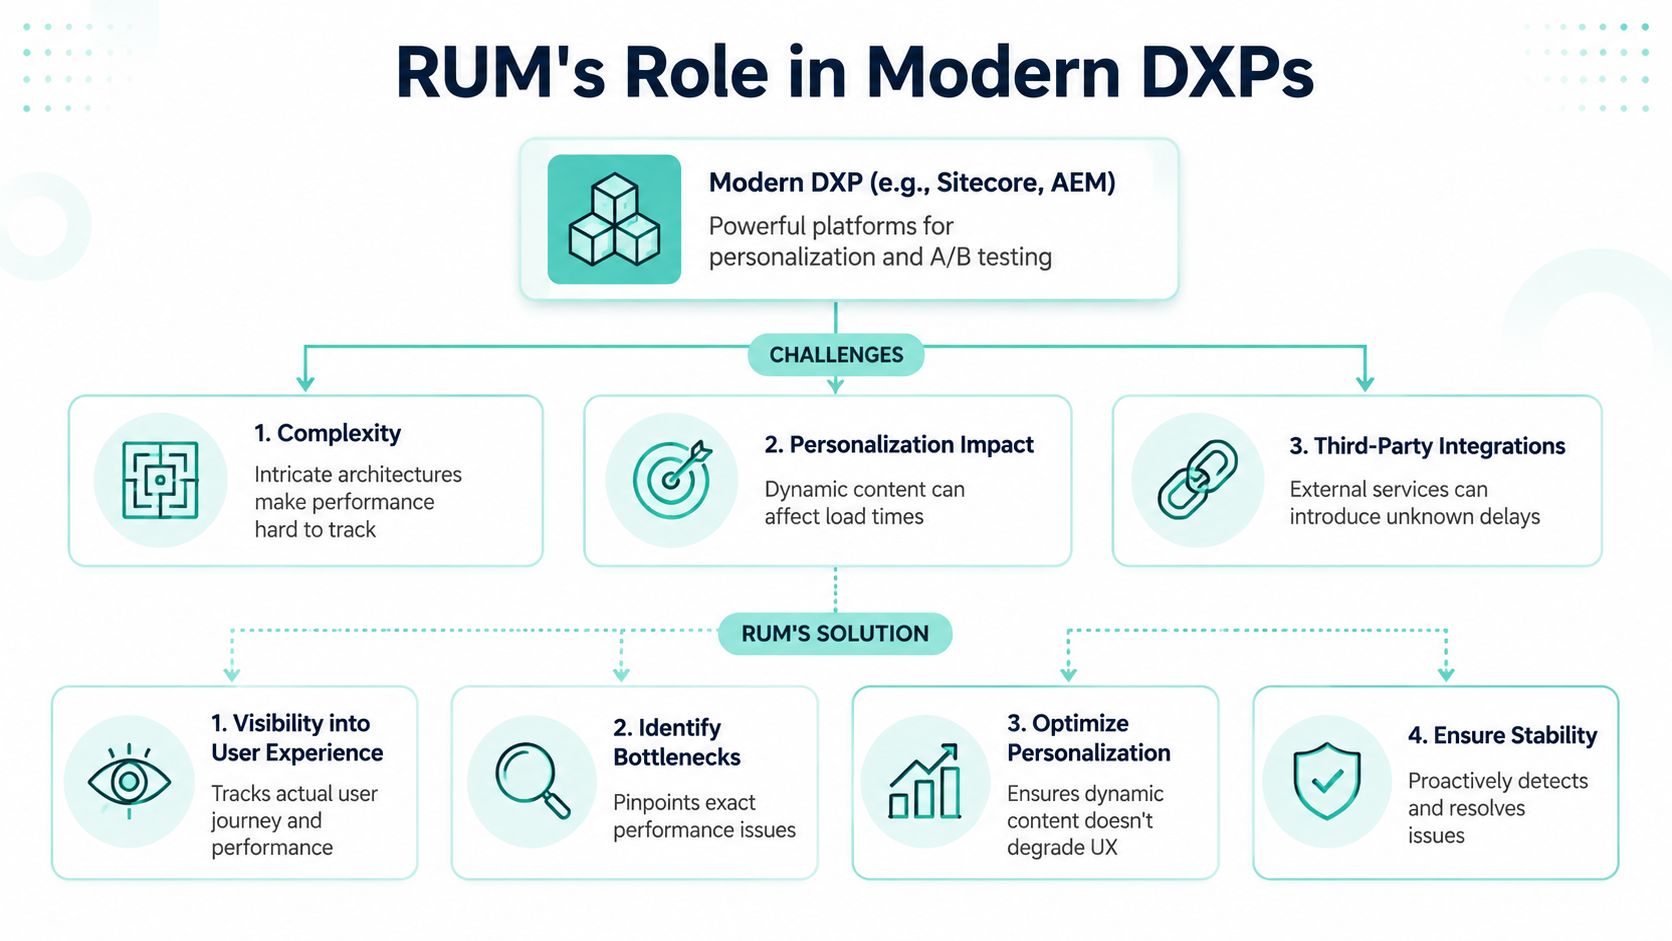
Complexity hides user impact
RUM is particularly strong in heterogeneous environments. It helps identify misconfigurations and slow connections by observing what users experience. If response times degrade only for certain browser, device, or network combinations, RUM can isolate the affected cohort and quantify the impact, which is why enterprise monitoring approaches such as SAP Cloud ALM's real user monitoring guidance emphasize transparency into end-user response times across varied platforms.
That matters directly in Sitecore.
A personalization rule may only affect users from one market. A third-party recommendation component may only slow pages when a specific audience segment is eligible. An AI-powered search or content suggestion layer may return quickly in one region and slowly in another. Without RUM, those issues dissolve into averages.
Where Sitecore leaders usually miss the problem
Most enterprise teams already monitor infrastructure. Many also track APM and logs. Fewer monitor how specific Sitecore features affect real sessions.
The usual blind spots are easy to recognize:
- Personalization without field validation leaves teams unsure whether customized experiences improved engagement or just added weight
- A/B testing without performance segmentation can hide the fact that a winning variant converts worse for a browser segment experiencing slower rendering
- Composable integrations without session tracing make it hard to know whether delays came from content APIs, search calls, DAM fetches, or frontend execution
- AI features without runtime observation create confidence in model output while leaving delivery latency unmeasured at the user level
Sitecore leaders should treat RUM as part of feature governance, not just technical monitoring. If a new component or AI-assisted experience goes live, the acceptance criteria should include real-session behavior, not just functional correctness.
For modern DXPs, observability isn't complete until the user session confirms the architecture worked.
Expert Guidance for Implementing RUM on Sitecore and SharePoint
Most generic RUM advice falls apart when it assumes a modern client-heavy application with a straightforward JavaScript snippet and clean browser events. Enterprise CMS platforms don't always behave like that.
Most RUM guides focus on client-side JavaScript applications and overlook enterprise CMS environments such as Sitecore or AEM where content is heavily server-rendered. A significant portion of large organizations still rely on hybrid architectures, yet vendor documentation often doesn't give CTOs a clear implementation path for those setups. That gap is exactly why Sitecore and SharePoint programs need a more disciplined approach.

Sitecore XP and XM Cloud need different instrumentation habits
For Sitecore XP or XM with server-side rendering, start with placement discipline. The RUM tag should load consistently across layouts and not be treated as an afterthought in a single front-end theme. If different tenants, sites, or rendering hosts exist, confirm instrumentation coverage at each delivery boundary.
Then make SSR visible in your telemetry model.
A few rules work well:
- Capture route and template context so the beacon can distinguish page types, not just URLs.
- Add component-level markers selectively for high-impact renderings such as hero blocks, search components, forms, recommendations, or consent layers.
- Tag personalization states carefully. Don't send sensitive profile data, but do capture enough context to compare personalized and non-personalized variants.
- Separate content problems from delivery problems. A slow page and a failed component are not the same issue.
For XM Cloud and composable Sitecore builds, treat the browser as one telemetry node in a larger transaction. Headless rendering hosts, edge delivery, GraphQL calls, search APIs, DAM services, and commerce endpoints all contribute to the session.
Correlate browser sessions with backend work
This is the implementation step that matters most in composable DXPs. If RUM says a page was slow, you need to connect that session to backend logs and traces.
Use a correlation approach that includes:
- A shared request or trace identifier passed from the frontend beacon context into server-side logging and tracing
- Consistent timestamp handling across browser events, rendering hosts, APIs, and asynchronous processing
- Journey-aware naming so traces align to meaningful Sitecore routes, not only technical endpoints
- Privacy controls to prevent user identifiers or content-derived PII from leaking into telemetry
In practical terms, that means instrumenting the rendering layer, API gateway, and downstream services so a single user action can be followed across the stack. If your team already manages analytics tagging, the operating model is similar. The difference is that now you're connecting performance and stability to distributed execution, not just tracking clicks. For teams tightening behavioral measurement alongside experience data, event tracking in Google Analytics is often part of the same governance conversation.
If your team can't answer which backend call made a slow session slow, your RUM implementation is incomplete.
One more point for Sitecore AI work. Whether you're using AI for content operations, search refinement, recommendations, or personalization support, measure each AI-driven touchpoint as a distinct dependency. Don't bundle it into a generic page metric. CTOs need to know whether the intelligence layer is improving the experience or introducing latency and inconsistency.
SharePoint needs the same discipline
SharePoint intranets and portals have different user journeys, but the monitoring challenge is similar. Custom web parts, document integrations, identity dependencies, and embedded business applications can all degrade the session without creating a clean application error.
A strong SharePoint RUM rollout usually includes:
- Page classification for publishing pages, dashboards, search views, and document-heavy experiences
- Custom web part instrumentation so teams can distinguish platform latency from component latency
- Authentication-aware segmentation because employee experiences often differ sharply between logged-in states, network paths, and device policies
- Task-based reporting that reflects what users were trying to do, such as search, submit, review, or approve
This is also the point where one implementation partner can help unify architecture and monitoring. Kogifi works across Sitecore AI, SharePoint, and broader DXP delivery, which is useful when RUM needs to align with platform upgrades, audits, and operating support rather than sit as a disconnected tool.
From Data to Decisions Choosing and Using a RUM Solution
A release goes live. Synthetic checks stay green. Support tickets start an hour later from one market, on one browser family, after login. That is the point where a RUM product either helps the team isolate the issue fast, or adds another dashboard that no one trusts.
For Sitecore and SharePoint estates, tool selection should start with one question. Can this platform connect user impact to the systems that caused it? Browser charts alone are not enough in a composable DXP with SSR, CDNs, personalization rules, APIs, search, identity, and third party services all shaping the page.
Choose for correlation not just dashboards
Choose a platform that can tie frontend events to backend execution and delivery context. If a page slowed down, the team should be able to see whether the cause sits in the rendering host, a personalization decision, a search request, a consent script, or an upstream API. That matters far more than polished charts.
A practical evaluation checklist includes:
- APM and distributed tracing integration so browser timings can be matched to server activity and dependency calls
- Support for SSR, edge delivery, and hybrid rendering because enterprise Sitecore builds rarely behave like simple single-page applications
- Deep segmentation across route, device, browser, geography, login state, campaign, and journey stage
- Privacy and governance controls such as anonymization, field scrubbing, and consent-aware capture
- Sampling controls that let teams increase visibility during releases, incidents, or high-value journeys without collecting everything at full volume all the time
It also helps to compare the product against the website performance monitoring tools enterprises typically review, because the actual gap is often correlation depth, not feature count.
Different teams will judge the same platform differently. Operations needs alerting and incident triage. Product owners need cohort and journey analysis. Architecture teams need enough context to trace a poor session back to a component pattern, integration path, or hosting decision. If one tool cannot support all three views, expect adoption problems.
Build an observability routine
Tooling does not create operational discipline. Teams do.
A workable cadence is simple. Review degraded cohorts weekly. Compare release windows after major Sitecore changes. Assign ownership for the highest-impact user issues, not just the loudest technical alerts. That is how RUM becomes part of delivery governance instead of a passive reporting layer.
Use the output to make decisions such as:
- Which Sitecore components need redesign because they repeatedly slow interaction or render inconsistently
- Which third party scripts should be delayed, removed, or isolated behind stricter loading rules
- Which browser, market, or authenticated user segments need targeted fixes
- Which AI-assisted experiences are improving task completion and which are adding latency without enough value
In practice, the strongest RUM programs treat performance review like architecture review. They connect user evidence to release management, backlog prioritization, and platform standards. Once that happens, conversations change. The CTO sees where experience risk sits in the stack, and delivery teams know what to fix first.
If your Sitecore or SharePoint platform needs clearer visibility into what users experience, Kogifi can help align real user monitoring with architecture, performance optimization, and enterprise DXP delivery practices.