

Your Sitecore site can return a 200 response and still be failing customers. The homepage loads, but personalization stalls. Search works in one region and breaks in another. The login page renders, but forms don't submit because an upstream service is degraded. In SharePoint, the portal is reachable, yet search, document previews, or embedded integrations are the parts users need and the parts that are failing without detection.
That's the gap between basic availability checks and real website uptime monitoring.
In enterprise DXP and CMS estates, uptime isn't a single green light. It's the combined health of pages, APIs, rendering paths, personalization services, search, identity, storage, and third party dependencies. If you manage Sitecore XP, XM Cloud, SharePoint Online, or hybrid enterprise platforms, you need monitoring that reflects how the platform behaves under real operating conditions, not just whether a server responded.
Table of Contents
- Sitecore monitoring needs component awareness
- SharePoint monitoring needs service-path visibility
- Global coverage needs deliberate probe design
Why Uptime Monitoring is Your Digital Lifeline
The incident usually starts in a familiar way. Marketing says the campaign page is live. Operations sees healthy infrastructure. Then support starts getting messages from one geography saying checkout hangs, another saying the page is blank, and an executive saying the board can't access the SharePoint intranet from mobile.

That's why website uptime monitoring matters. It's not a reporting exercise for IT. It's a control for business continuity across revenue paths, employee collaboration, partner access, and regional delivery.
On simple websites, one availability check can catch a lot. On Sitecore and SharePoint, it can miss the failures that matter most. A CDN may still serve cached markup while search is dead. A page may render while a personalization dependency times out. SharePoint may authenticate users while document operations fail under load or due to downstream service issues.
Downtime is often partial before it is obvious
Most enterprise outages don't arrive as a clean full-site failure. They show up as partial, conditional, and ugly:
- Regional failures: one market sees timeouts while another looks normal
- Functional failures: login, checkout, search, or form submission breaks first
- Dependency failures: identity, CRM, CDN, marketing automation, or search services drag down the user journey
- Editorial failures: content authors can't publish even though the public site is still online
A site can be technically up while the experience customers need is already down.
Teams that treat monitoring as a digital lifeline build checks around those realities. They monitor public journeys, authoring workflows, and the hidden components that power both. That's what keeps incidents small, detectable, and recoverable.
Core Monitoring Concepts Synthetic vs RUM
Synthetic monitoring and Real User Monitoring solve different problems. You need both if you run a serious DXP.
Synthetic monitoring behaves like a disciplined inspector. It visits key pages and transactions on a schedule, from known locations, using a known script. That makes it ideal for checking whether the homepage loads, whether a Sitecore form submits, whether a SharePoint login flow completes, or whether a search result page renders expected content.
RUM behaves like field telemetry from actual visitors. It shows what users are experiencing in their real browsers, on real devices, over real networks. That's where you see issues synthetic checks often miss, such as a problematic browser version, a degraded script, or a third party dependency affecting only one segment of traffic. For enterprise uptime monitoring, guidance recommends combining active uptime checks with RUM so teams can catch partial outages before they spread across the SLA boundary, as explained in Catchpoint's overview of website uptime monitoring.
What synthetic checks do well
Synthetic checks are best when you need consistency and intent. You define what “healthy” means, then test for it repeatedly.
| Aspect | Synthetic Monitoring | Real User Monitoring (RUM) |
|---|---|---|
| Test source | Controlled probes | Actual visitor sessions |
| Best use | Known critical paths and pre-defined checks | Detecting lived experience across browsers, devices, and networks |
| Strength | Repeatable, comparable, alert-friendly | Reveals issues affecting real users in production |
| Blind spot | Can miss browser-specific or user-specific problems | Can't test journeys when no users are active |
| Sitecore fit | Homepage render, search, form submit, personalization fallback | Real regional experience, rendering weight, script impact |
| SharePoint fit | Login path, page availability, search result rendering | Employee experience across offices and devices |
Synthetic monitoring is also where many teams start evaluating website performance monitoring tools, because scheduled checks are the fastest way to operationalize availability.
Where RUM changes the picture
RUM matters most when the platform is composable and globally distributed. Sitecore implementations often depend on CDNs, search, identity providers, analytics, personalization, and client-side assets. SharePoint environments often depend on authentication, Microsoft 365 services, search, embedded documents, and tenant-specific configuration.
Use RUM to answer questions synthetic checks can't settle on their own:
- Who is affected: anonymous users, authenticated users, editors, internal staff
- Where it happens: one country, one office network, one mobile carrier
- What degrades first: large components, scripts, media-heavy pages, conditional features
- Whether the issue is intermittent: a critical clue in cloud and CDN-backed environments
A common failure pattern in Sitecore is this: synthetic checks say the page is up, but RUM shows one region is getting delayed personalization or broken client-side rendering. Another pattern in SharePoint is the reverse: user complaints appear first, then synthetic checks are added to validate whether a path is consistently failing.
Use synthetic checks to ask, “Can this path complete?” Use RUM to ask, “How is it behaving for real people?” You don't need to choose between them. You need to design them together.
Defining Enterprise-Grade Metrics and SLAs
If your SLA only says the site must be reachable, it's too shallow for a DXP. Enterprise monitoring has to represent service quality, not just host response.
A useful benchmark is the five nines standard. 99.999% uptime corresponds to about 5.25 minutes of downtime per year, while 99.99% still allows about 52 minutes and 36 seconds annually, according to Monitor.us on website uptime. For Sitecore estates with commerce, customer portals, or global campaign landing pages, that difference is operationally significant.

Build the SLA from the customer journey upward
Start with the journeys the business cannot afford to lose. For Sitecore, that may be product discovery, account login, lead form submission, checkout, or personalized content delivery. For SharePoint, it may be employee access, search, document retrieval, approval workflows, or departmental publishing.
Then define a monitoring pyramid:
Reachability
The endpoint responds. This is necessary, but weak on its own.Performance
The page responds quickly enough to be usable. Slow systems often fail business expectations before they fail availability checks.Functional integrity
Core user actions complete. Forms submit. Search returns results. Authentication works. Components render expected content.Journey completion
Multi-step paths succeed end to end. This is the level teams frequently under-monitor and regret during incidents.
Practical rule: If the business writes an SLA around “availability,” operations should translate it into monitored journeys, not just URLs.
What to measure on Sitecore and SharePoint
On Sitecore, the right metrics usually sit at component and transaction level:
- Rendering health: key layouts and components return expected content
- Search behavior: result pages load and queries return usable output
- Forms and integrations: lead capture, profile updates, and downstream submissions complete
- Personalization dependency health: customized experiences don't block rendering when a service is slow
- Authoring signals: editors can log in, preview, publish, and verify content propagation
On SharePoint, useful enterprise metrics often include:
- Portal access: authentication and landing page load
- Search availability: users can find documents, pages, and people
- Document interaction: open, preview, and download paths remain healthy
- Workflow continuity: approvals and related business processes don't stall
- Service path consistency: embedded content and connected Microsoft services behave as expected
The mistake is to make every metric equal. A broken favicon and a broken checkout path aren't the same. Your SLA model should reflect that difference, and your alerting should too.
Monitoring Architectures for Sitecore and SharePoint
A strong monitoring architecture mirrors the platform architecture. If the platform is distributed, event-driven, and dependency-heavy, monitoring has to be the same. One homepage check won't tell you much about a modern Sitecore or SharePoint environment.

Sitecore monitoring needs component awareness
For Sitecore, I'd split monitoring into public experience, authoring capability, and service dependencies.
On the public side, monitor page render success, key templates, search, forms, identity-dependent journeys, and commerce or conversion paths. For composable Sitecore builds, also watch the APIs and edge services that supply content, personalization, or search. If the page shell loads but content APIs fail, users still experience downtime.
On the authoring side, monitor CM access, publishing operations, preview, and any workflow actions that content teams depend on. A public site can look fine while editorial operations are blocked. In a campaign-heavy organization, that's a real incident.
For Sitecore AI-related services and personalization layers, monitor whether responses arrive within acceptable bounds and whether the platform has a graceful fallback. A personalized experience that blocks page render is poor design. Monitoring should confirm the fallback path works when the AI or decisioning service is degraded.
Useful layers to separate include:
- Edge and delivery: CDN behavior, public endpoints, cache effectiveness, static asset availability
- Application layer: rendering host, content APIs, search APIs, forms endpoints
- Platform services: publishing, identity, analytics-related services, integrations
- External dependencies: CRM, marketing automation, payment, DAM, translation, and search providers
Where cloud models differ, architecture matters. Teams running mixed hosting and managed components usually benefit from understanding service boundaries early, especially when deciding what they own versus what a provider owns. This is the practical side of IaaS, PaaS, and SaaS in cloud computing.
SharePoint monitoring needs service-path visibility
SharePoint environments need a similar breakdown, but the operational paths are different. You're typically protecting collaboration rather than a public marketing funnel, though many organizations use SharePoint for both internal and external-facing workloads.
Monitor:
- User entry points: portal homepage, authentication, conditional access outcomes
- Search path: index freshness signals, query execution, result rendering
- Document path: open, preview, edit, save, and permission-sensitive access
- Workflow path: approvals, notifications, embedded forms, connected lists or apps
- Administrative path: publishing, navigation updates, and service health visibility
The most common monitoring miss in SharePoint is assuming availability equals usability. Employees don't care that the landing page responded if search is returning nothing or document previews are timing out.
Global coverage needs deliberate probe design
Single-location monitoring is a comfort blanket. It tells you one place can see one thing. Global brands need more.
Guidance for distributed environments emphasizes choosing probe locations, alert thresholds, and escalation rules to catch partial outages caused by upstream cloud or CDN providers, as discussed in global uptime monitoring guidance from Odown. That matters directly for Sitecore solutions serving multiple regions, multiple languages, and different delivery paths.
A practical design usually includes:
- Market-based probes: place checks near the regions your users care about
- Path-specific probes: assign different checks to homepage, login, search, forms, and APIs
- Dependency-aware alerts: separate app failures from CDN, DNS, identity, or integration failures
- Escalation by ownership: route incidents to platform, infrastructure, development, or vendor teams based on the failing layer
Don't ask one probe whether the platform is healthy. Ask several probes whether the experience is healthy where your users actually are.
That's the difference between generic uptime reporting and usable operations.
Designing Smart Alerts and Actionable Runbooks
An alert fires at 2:13 a.m. The homepage still returns 200, but login is failing for users in two regions and Sitecore authors cannot publish campaign content. If your alert only says "site down," the on-call engineer starts blind.
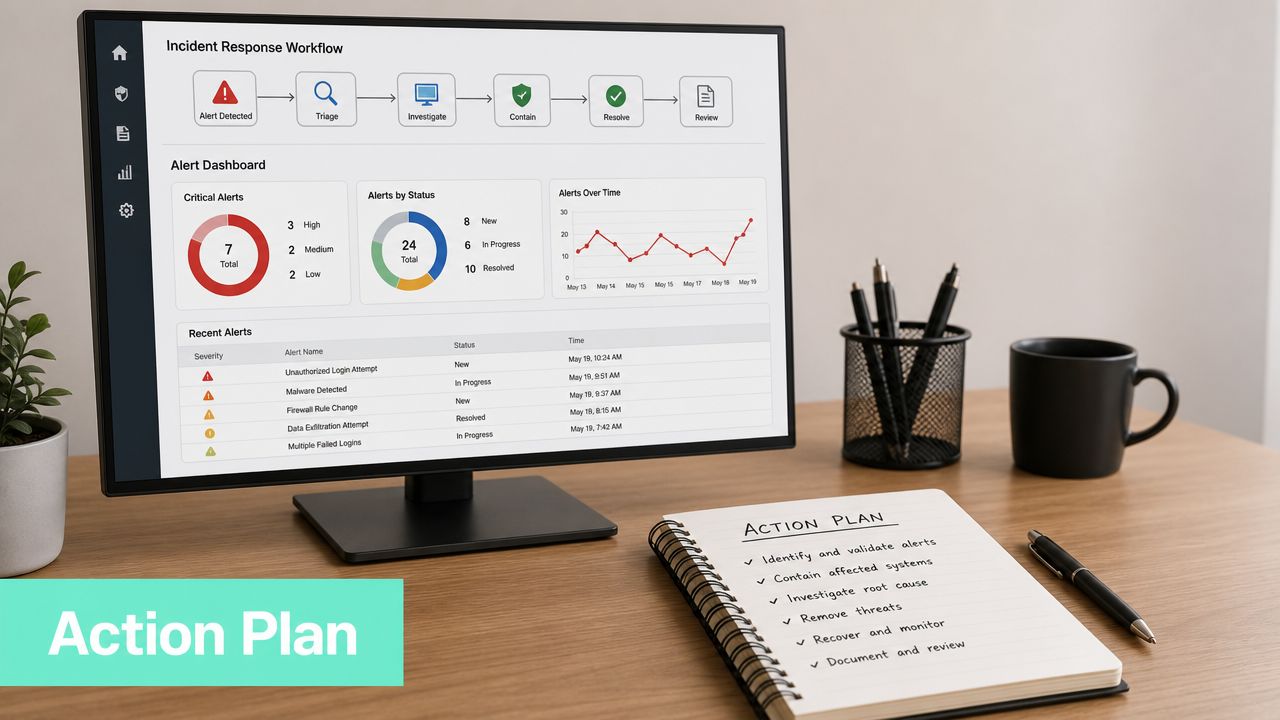
In Sitecore and SharePoint environments, good alerting is less about counting failed checks and more about identifying which user journey, component, or operating path has broken. Enterprise teams need alerts that point to business impact and likely ownership.
Alert on business impact, not raw noise
Set check frequency by service criticality. Guidance for business-critical applications recommends checks every 5 to 10 minutes, while critical e-commerce sites should be checked every 1 to 5 minutes, with multi-region probes to reduce false positives, as outlined in Odown's website uptime monitoring guidance.
The paging rule should be tighter than the check rule.
A practical model is tiered alerting:
- P1 conditions: full public outage, failed checkout, failed login, or repeat failure of a revenue or service-critical journey across regions
- P2 conditions: a major capability is impaired, such as search, publishing, document access, or SSO
- P3 conditions: degraded performance, intermittent regional issues, or heavy use of a fallback path
- Informational events: single-probe failures, planned maintenance, or non-critical component warnings
For composable DXP platforms, ownership matters as much as severity. A failed Sitecore content delivery transaction belongs in a different queue from a failed content management publishing job. In SharePoint, an employee-facing search failure may need a different response path from a tenant-wide authentication issue. Route alerts by service owner, not just by priority.
If you are defining escalation paths for managed services, cloud dependencies, and shared support teams, structured SaaS incident response procedures are a useful reference for ownership boundaries, communications, and handoffs.
What a Workable Runbook Contains
A runbook should help an engineer act in the first few minutes. It should not read like platform documentation.
Include these elements:
Trigger definition
State exactly what fired. "Search journey failed in two regions" is actionable. "Website alert" is not.Scope check
Confirm whether the problem affects one probe, one component, one environment, or one dependency. Check recent deployments, feature flags, publishing queues, scheduled jobs, and upstream platform status.Platform-specific failure patterns
For Sitecore, document known issues tied to rendering hosts, search indexes, identity, forms, xConnect, personalization, or publishing. For SharePoint, capture patterns around authentication, search, document services, embedded apps, and permissions.Containment actions
Roll back a deployment, disable a failing feature, switch to fallback content, stop a broken job, or reroute traffic if the architecture supports it.Escalation path
Name the owner for application code, platform operations, cloud infrastructure, third-party integrations, and stakeholder communications.User communication template
Give service desk and business teams plain-language updates that describe impact, affected journeys, and next update time.
Runbooks are especially important during migration windows, release cutovers, and topology changes. That is when partial failures appear. Search reconnects but media does not. Authoring works but public delivery nodes fail health checks. Planning those response steps before the change starts reduces recovery time, especially during Sitecore migration cutovers designed to minimize downtime.
Here's a short walkthrough that captures the operating mindset behind good alerting:
The best alert gives the responder the symptom, the likely blast radius, and the first three checks to run.
Integrating Uptime with Your Observability Stack
At 2:13 a.m., the homepage still returns 200. Editors can log in. The platform looks healthy from a basic uptime view. But product search has stopped responding in one region, a personalization service is timing out, and checkout is failing for a subset of users. In Sitecore and SharePoint estates, that is a common incident shape.
Uptime monitoring should feed the same operating workflow as logs, traces, deployment data, and service metrics. If those signals sit in separate tools, the response team wastes time proving whether the problem sits in application code, a shared service, a content delivery role, an identity provider, or a third-party dependency.
Correlate symptoms with service boundaries
Send failed checks and synthetic transaction results into Azure Monitor, Datadog, New Relic, or the logging platform your operations team already uses. The value is not the failed probe by itself. The value is seeing that failure alongside a deployment marker, a spike in authentication errors, rising search latency, or a queue backlog in a downstream service.
For composable DXP platforms, correlation needs to follow the architecture. A Sitecore alert should be traceable to delivery, CM, CDNs, search, xConnect, identity, media, or publishing. A SharePoint alert should be traceable to authentication, search, document access, embedded apps, or tenant-level integrations. That service mapping is what turns a red status into a useful diagnosis path.
The practical question is simple. Which component broke the user journey?
Build incidents around context, not raw alerts
Email alerts create noise. Incident records create accountability.
A workable pattern usually looks like this:
- Monitoring tool: detects page failures, API failures, and broken synthetic journeys
- Observability platform: adds traces, logs, infrastructure metrics, client-side errors, and deployment correlation
- Incident system: assigns severity, ownership, and escalation based on the affected service
- Collaboration layer: posts the incident to the right operational channel with current impact and timeline
For enterprise teams, enrichment matters as much as detection. A failed login check should arrive with the affected environment, region, recent release reference, linked dashboard, and the owning team. A failed authoring check should be routed differently from a public delivery outage. A partial search failure should open against the search service owner, not the general web support queue.
One option in that model is to combine monitoring tooling with managed cloud service support for enterprise digital platforms when the platform spans multiple vendors, cloud services, and internal teams. That becomes useful when uptime monitoring is only one part of the support problem and the bigger challenge is coordinating investigation and response across the full stack.
Done properly, uptime becomes the trigger, not the destination. The monitoring check detects the symptom. The observability stack gives the responder enough evidence to isolate cause, assess blast radius, and start recovery without losing the first twenty minutes to tool switching.
Conclusion Building a Resilient Digital Experience
Website uptime monitoring for Sitecore and SharePoint has to reflect the actual shape of the platform. That means checking transactions, components, integrations, and regions. It means watching editorial capability as well as public delivery. It means treating partial failure as a first-class operational problem, not a corner case.
The teams that do this well don't settle for a green homepage probe. They map monitoring to business-critical paths, assign ownership by service boundary, and write runbooks that people can effectively use under pressure. They also connect uptime signals to observability so incidents can move from detection to root cause quickly.
That's what resilience looks like in practice. Not perfection. Not zero incidents. A platform that detects problems early, contains them quickly, and protects the customer experience when something goes wrong.
If your current monitoring still answers only “is the site up?”, it's time to redesign it around the journeys and services your business depends on. For organizations operating enterprise CMS and DXP estates, managed operating models can also close the gap between tooling and response. That's one reason teams often pair monitoring strategy with managed cloud service support when availability requirements get harder to meet.
Frequently Asked Uptime Monitoring Questions
| Question | Answer |
|---|---|
| Is a basic ping or HTTP 200 check enough for Sitecore? | No. It confirms reachability, not whether search, forms, personalization, content APIs, or rendering dependencies are working. For Sitecore, monitor the page plus the services behind the page. |
| What should be the first synthetic transaction in a Sitecore implementation? | Start with the highest-value public journey. For many organizations that's login, form submission, product discovery, or checkout. Pick the one that creates immediate business impact if it fails. |
| How is SharePoint uptime monitoring different from public website monitoring? | SharePoint monitoring usually has more emphasis on authentication, search, document operations, permissions, and workflow paths. A portal that loads but can't find or open documents is not healthy from a user perspective. |
| Do we need separate monitoring for authors and public users? | Yes, in most enterprise CMS environments. Editors need publishing, preview, workflow, and admin capabilities. Public users need fast, reliable access to content and functions. One can fail while the other still works. |
| How many probe locations should we use? | Use locations that reflect your real user footprint and critical markets. The right count depends on geography, support model, and contractual obligations. More important than quantity is coverage of meaningful regions and paths. |
| Should every alert page the on-call team? | No. Page on-call staff for high-impact failures. Route lower-severity issues to queues, dashboards, or working-hours triage. Without severity discipline, teams develop alert fatigue quickly. |
| What's the biggest monitoring mistake in composable DXPs? | Treating the front-end response as proof the experience is healthy. In composable architectures, the visible page may depend on several APIs and third-party services. Monitor the dependency chain, not just the shell. |
| How often should runbooks be reviewed? | Review them after incidents, after major releases, during architectural changes, and when ownership changes. A stale runbook is almost as risky as having none. |
If you're running Sitecore, SharePoint, or another enterprise DXP and your current monitoring still feels too shallow, Kogifi can help you assess the platform, identify weak points in critical journeys, and shape an uptime strategy that matches how your digital estate works.