

At 02:00, a Sitecore content management workload can look healthy in a dashboard while a background publishing job stalls. By the time the marketing team discovers that new content hasn't reached a paying client's site, the problem is no longer a single failed process. It has become a release, revenue, and reputation incident. SharePoint Online integrations create similar blind spots when an Azure Function stops synchronizing content, authentication begins failing, or an API remains degraded without producing an obvious platform outage.
Azure monitoring alerts are the operational safety net beneath those dashboards and logs. They turn telemetry into a state change, route that state to an owner, and, when appropriate, start a controlled response. The difficult work isn't creating a rule. It's deciding which signals deserve attention, how to avoid duplicate pages, and how to preserve enough diagnostic context for the engineer who responds.
Table of Contents
Why Azure Monitoring Alerts Matter for Enterprise Platforms
A dashboard tells you what's happening when someone looks at it. A log records what happened and provides evidence for investigation. Neither one, by itself, guarantees that the right person knows a customer-facing failure has started.
That distinction matters in an enterprise DXP. A Sitecore CM service might continue responding to health checks while indexing, publishing, or search-related work degrades in the background. A SharePoint-connected workflow might still accept requests while its queue grows and its synchronization process stops moving. The platform can appear available to infrastructure teams while editors, marketers, employees, or external customers experience missing content.
Microsoft defines Azure Monitor alerting around an alert rule that combines the monitored resource, the signal or metric data, and the condition that should trigger notification. Microsoft also positions alerts as a way to detect incidents proactively and initiate automated responses, rather than just observe them after the fact. The Azure Monitor metric alert rule documentation describes how rules can be created from Azure Monitor or a resource's Alerts pane, with Azure CLI commands available for managing metric alert rules.
Practical rule: If a failure can affect publishing, content delivery, employee access, or an integration contract, it needs an owner and an alert path, not just a dashboard tile.
The useful test is simple. Ask what happens if the warning appears overnight, during a content freeze, or while the primary platform team is working on another incident. If nobody receives a meaningful notification, the monitoring design has stopped at observation.
For Sitecore estates, that means connecting application symptoms with deployment activity, search behavior, publishing state, and end-to-end availability. For SharePoint solutions, it means combining Microsoft 365 service behavior with Azure Functions, queues, authentication, and user-facing checks. A carefully designed alert can give a non-engineering stakeholder the information they need, such as which experience is affected, who owns it, and whether a response is already underway.
A practical website uptime monitoring approach complements Azure Monitor because synthetic checks validate the experience from outside the platform. Internal telemetry explains why a service is unhealthy. Synthetic monitoring confirms whether users can reach and use it.
The Four Alert Types and How Alert Rules Actually Work
Azure Monitor documents four core alert types: metric alerts, log search alerts, activity log alerts, and Prometheus alerts. They share the same broad response pipeline, but they inspect different evidence.
A metric alert is the smoke detector reading a dial. It evaluates a time-series value such as CPU, request latency, or an application metric at regular intervals. Metric alert rules are stateful, so they notify when the alert state changes rather than repeatedly sending the same notification while the breach remains open. For a Sitecore App Service, this is a natural fit for sustained resource pressure or a user-visible latency signal.
A log search alert is the detective scanning narrative evidence. It runs a KQL query against Log Analytics or another supported log source, making it useful when the condition depends on correlation. For example, a SharePoint integration may need a query over AppRequests and function logs to identify a pattern involving failed requests, an operation name, and a related exception. Logs are powerful, but broad queries can be harder to tune and govern.
An activity log alert watches the control-plane door log. It responds to Azure subscription or resource-management events, such as a deployment, configuration change, or resource operation. It won't reliably detect an application-layer publishing failure, but it can provide the context needed to correlate that failure with a recent change.
A Prometheus alert speaks the AKS language. It evaluates Prometheus metrics and is well suited to Kubernetes signals such as pod restarts, container saturation, and workload availability. For an XM Cloud-related workload running with Kubernetes observability, PromQL can express relationships that a single platform metric can't.
What an alert rule contains
Every rule should make its intent obvious:
- Scope: Identify the resource, workspace, subscription, or other monitoring boundary.
- Signal: Select the metric, log query, activity event, or PromQL expression.
- Condition: Define the comparison, aggregation, evaluation window, and state behavior.
- Action group: Attach the notification and automation receivers.
- Severity: Establish the expected response path.
- Resolved state: Tell responders when the condition has cleared.
| Alert Type | Signal Source | Typical Latency | Best-Fit Workload | Common Pitfall |
|---|---|---|---|---|
| Metric | Platform, custom, or Application Insights metrics | Regular metric evaluation | CPU, latency, saturation, throughput | Treating a naturally variable signal as a fixed failure |
| Log search | KQL over Log Analytics data | Query and evaluation dependent | Distributed errors, failed jobs, correlated events | Scanning broad high-volume data without a precise query |
| Activity log | Azure control-plane events | Event delivery dependent | Deployments, policy changes, resource operations | Assuming it detects application faults |
| Prometheus | Prometheus or OpenTelemetry metrics | Rule evaluation dependent | AKS pods, containers, and cluster behavior | Alerting on every transient restart |
The practical selection guidance in website performance monitoring tools is useful here: performance signals need context. A latency metric can show that users are waiting. A correlated log query may explain whether the cause is search, authentication, a downstream API, or a failed deployment.
Action Groups and Integrations That Close the Loop
An alert without a response target is incomplete. Azure Monitor action groups provide reusable bundles of receivers and automation endpoints, including email, SMS, voice, push notifications, Azure App push, webhooks, ITSM connectors, Logic Apps, Automation Runbooks, and Event Hubs.
The flow should be deliberate:
- A rule evaluates its signal and changes state.
- Azure Monitor sends the alert to one or more action groups.
- Each receiver applies a different response, such as paging, ticket creation, enrichment, or remediation.
- The incident platform records ownership and progress.
- The alert eventually resolves or is closed with diagnostic evidence.
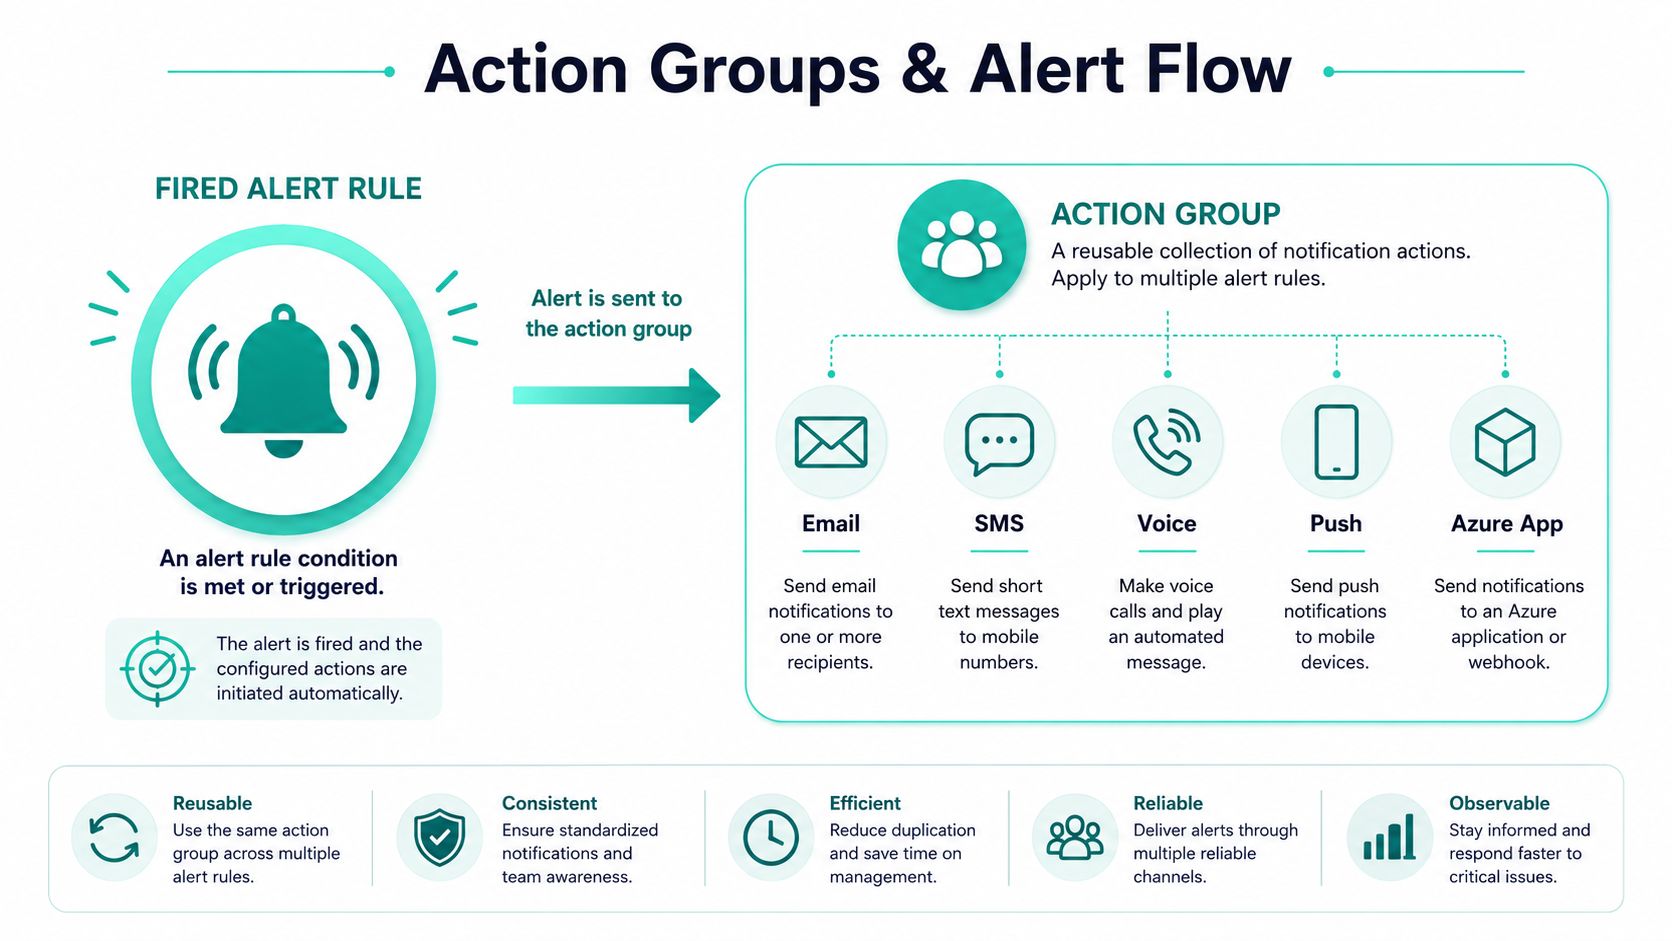
A single action group can serve many rules, which prevents every Sitecore or SharePoint alert from carrying its own copy of recipient configuration. Conversely, a rule can route to multiple action groups when severity or ownership requires it. A high-severity content delivery failure might page the on-call rotation, open an ITSM incident, and notify a platform channel. A lower-severity indexing warning might create a ticket without waking anyone.
A realistic remediation chain starts with a metric or log rule. The alert posts to a ServiceNow ITSM connector, while a Logic App reads the common alert payload and invokes an Automation Runbook. The runbook can perform a narrowly scoped, approved action, such as recycling an unhealthy Sitecore pod. The same event can notify the on-call channel by email or push notification.
The automation must be idempotent. If a webhook retries, the second delivery shouldn't create a duplicate incident or repeat a risky remediation. Use the alert identity, fired state, resource identifier, and correlation data as a deduplication key. Keep the payload useful but restrained. It should include workload, environment, owner, severity, rule name, and links to diagnostics, not customer records or proprietary content.
Teams connecting development work to service management may also benefit from guidance on connecting Azure DevOps to Freshservice, especially when an alert needs to become a tracked operational task rather than remain a message in a channel.
Tuning, Suppression, and Reducing Alert Fatigue
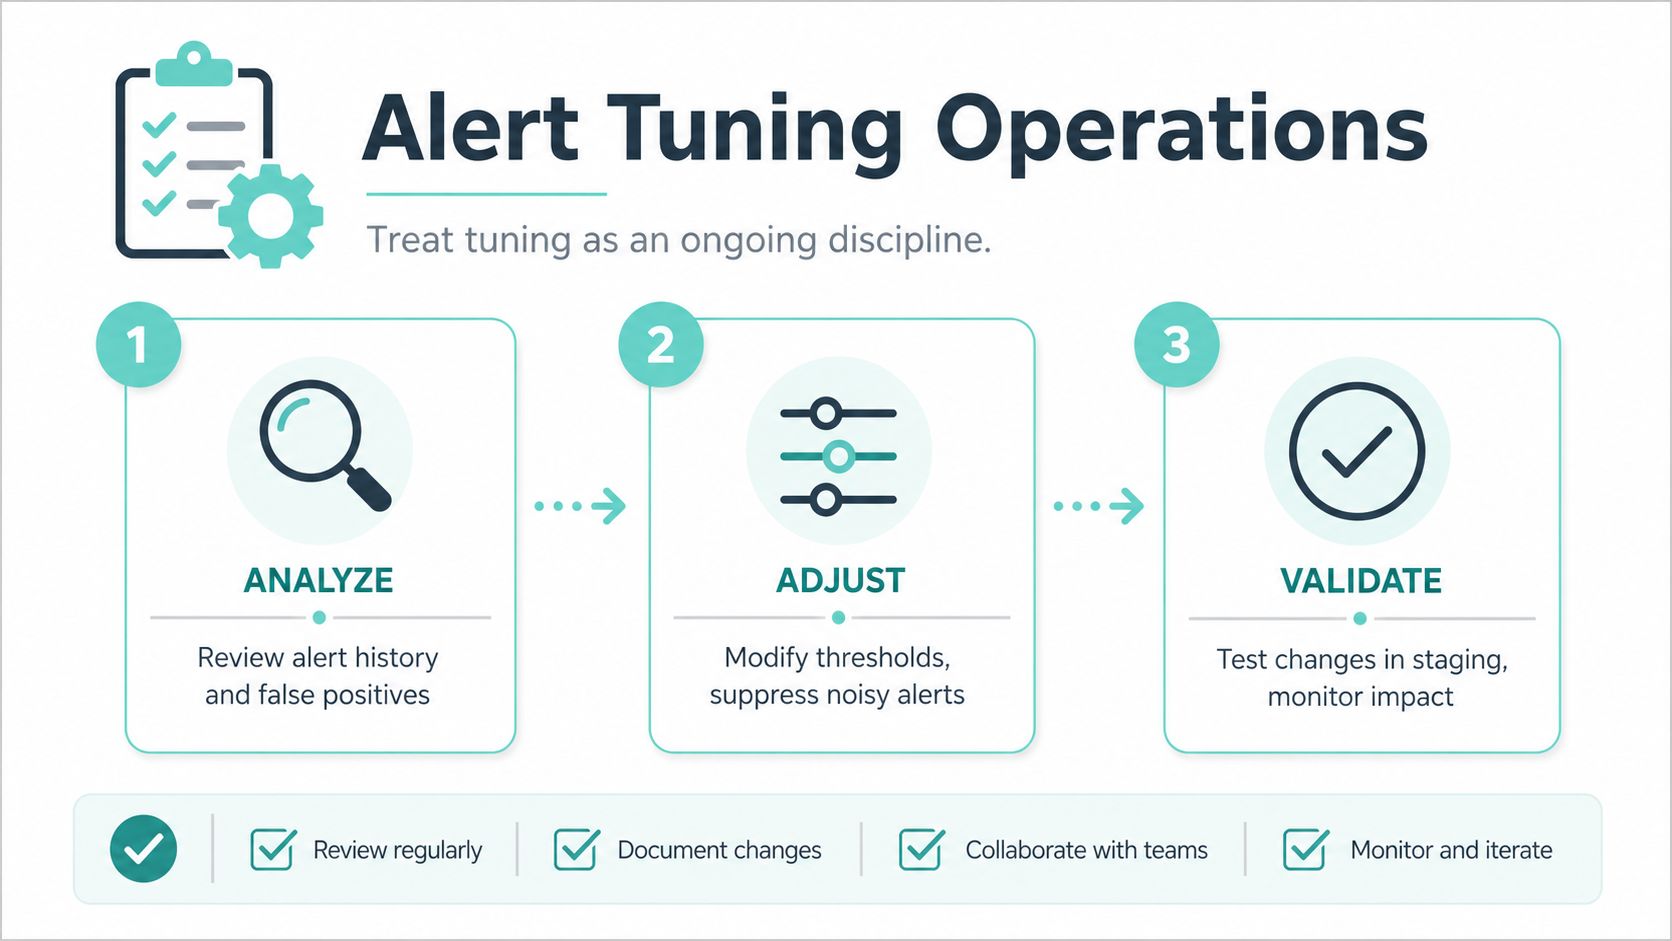
Alert tuning is an operations discipline, not a portal exercise completed during initial deployment. A Sitecore workload can produce separate signals for a failed content management pod, increased HTTP 5xx responses, and slow indexing. Each signal matters diagnostically, but sending three independent pages can obscure the single incident that responders need to understand.
Use a shared incident title, consistent resource grouping, and notification overrides to consolidate related symptoms. Keep the underlying diagnostic events available so the responder can distinguish a failed pod from a downstream search problem. The page should say what needs attention. The evidence should help explain why.
Match thresholds to the signal
Dynamic thresholds are useful for elastic signals whose normal behavior changes with time or workload. Request latency, throughput, and pod utilization often need a baseline rather than one universal boundary. Sparse data requires caution, because a dynamic model can't learn a dependable pattern from an empty or irregular history.
Static thresholds remain appropriate for contractual or operational bounds. Certificate expiry, database capacity, queue age, and other finite limits usually have a clear unacceptable condition. A static rule is easier to explain during an incident and easier to validate in a change review.
Suppress expected noise without hiding failures
Planned maintenance shouldn't require deleting or disabling alert rules. Use action-group suppression, planned maintenance communication, and scheduled processing behavior so the rule remains active and auditable. Processing rules can filter signals, group records, and enrich incidents with application, environment, owner, and change-ticket data.
Review the estate regularly:
- Firing frequency: Remove rules that trigger constantly without changing response behavior.
- Acknowledgement time: Reconsider severity or routing when responders consistently miss the intended window.
- Action-group effectiveness: Test email, webhook, ITSM, and automation receivers after every material change.
- Diagnostic value: Keep alerts that help identify customer impact or accelerate investigation.
- Evidence retention: Preserve the events needed to understand what happened, rather than only suppressing symptoms.
The objective isn't zero notifications. It's a page that a responder can act on, with enough context to avoid starting the investigation from an empty dashboard.
Cost, Security, and Scale Limits You Cannot Ignore
Azure monitoring alerts scale with the telemetry model behind them. Microsoft states that a metric alert rule is charged according to the number of time series monitored, not through a simple flat rule fee. A rule split across many dimensions can therefore expand its monitored surface and its cost, even when the rule itself looks small in the portal. The Azure Monitor alert types documentation also describes support for platform, custom, Application Insights, Prometheus, and OpenTelemetry-related metric scenarios.
Log alerts require a different cost conversation. Queries that scan large workspaces or run frequently can consume more analytical capacity than a focused metric rule. Narrow the time range, limit the data examined, and convert stable high-value signals into metrics where that produces a simpler evaluation path. Ingest only useful logs, and treat retention and notification channels as separate budget decisions. A focused review of cloud cost optimization should include monitoring rules, workspace ingestion, and abandoned alert resources.
| Signal Type | Typical Cost Profile | Operational Control | Best Use |
|---|---|---|---|
| Metric | Driven by monitored time series and dimensional fan-out | Reduce unnecessary dimensions and consolidate scope | Stable infrastructure and application signals |
| Log search | Driven by queried workspace data and evaluation activity | Narrow KQL, reduce scan range, control frequency | Correlation and diagnostic conditions |
| Activity log | Event-based control-plane monitoring | Scope events and ownership carefully | Deployments and resource changes |
| Prometheus | Depends on collected metric coverage and rule design | Control labels, cardinality, and query scope | AKS and cloud-native workload behavior |
Scale limits also affect reliability. Microsoft documents that log alerts support up to 5,000 active rules per subscription, with only 100 using a 1-minute frequency. Stateless rules can trigger up to 6,000 alerts per evaluation, while stateful rules can trigger up to 300. Stateful tracking supports up to 5,000 fired alerts per rule. Notification delivery is constrained by documented throttles of 300 notifications per minute per subscription per region and 100 notifications every 5 minutes per alert rule per region. These limits are detailed in Microsoft's Azure Monitor service limits.
Security deserves equal attention. Use managed identities for runbooks, least-privilege permissions for rule management, protected webhook secrets, and private connectivity where supported. Don't place customer data, document names, user identifiers, tokens, or sensitive SharePoint payloads in alert descriptions or automation parameters. Tag rules with application, environment, cost center, and data classification so quarterly reviews can remove abandoned configuration safely.
Patterns for Sitecore XM Cloud and SharePoint Workloads
Sitecore's next-generation DXP contains 11 products organized into three clouds, Content Cloud, Engagement Cloud, and Commerce Cloud, as described in its composable SaaS portfolio strategy. That breadth changes alert design. A content platform incident can involve content management, experience data, search, commerce, deployment, or an external integration rather than one server.
XM Cloud is a headless content management system built as a foundation for a composable DXP. Sitecore documents Experience Manager, SXA, the Next.js SDK, Experience Edge, and Pages as part of its feature set in the XM Cloud documentation. For an AKS-connected architecture, useful signals include cluster health, node and pod saturation, deployment status, ingress request rate, 4xx and 5xx responses, latency, container restarts, and failed jobs.
A practical Sitecore incident might begin with sustained resource pressure and rising publishing failures after a deployment. Correlate pod termination notices, deployment activity, database behavior, and search-service throttling before initiating remediation. An ITSM incident, a controlled GitHub rollback workflow, or a managed node-pool scaling action may be appropriate, but only where policy permits and the failure mode is well understood.
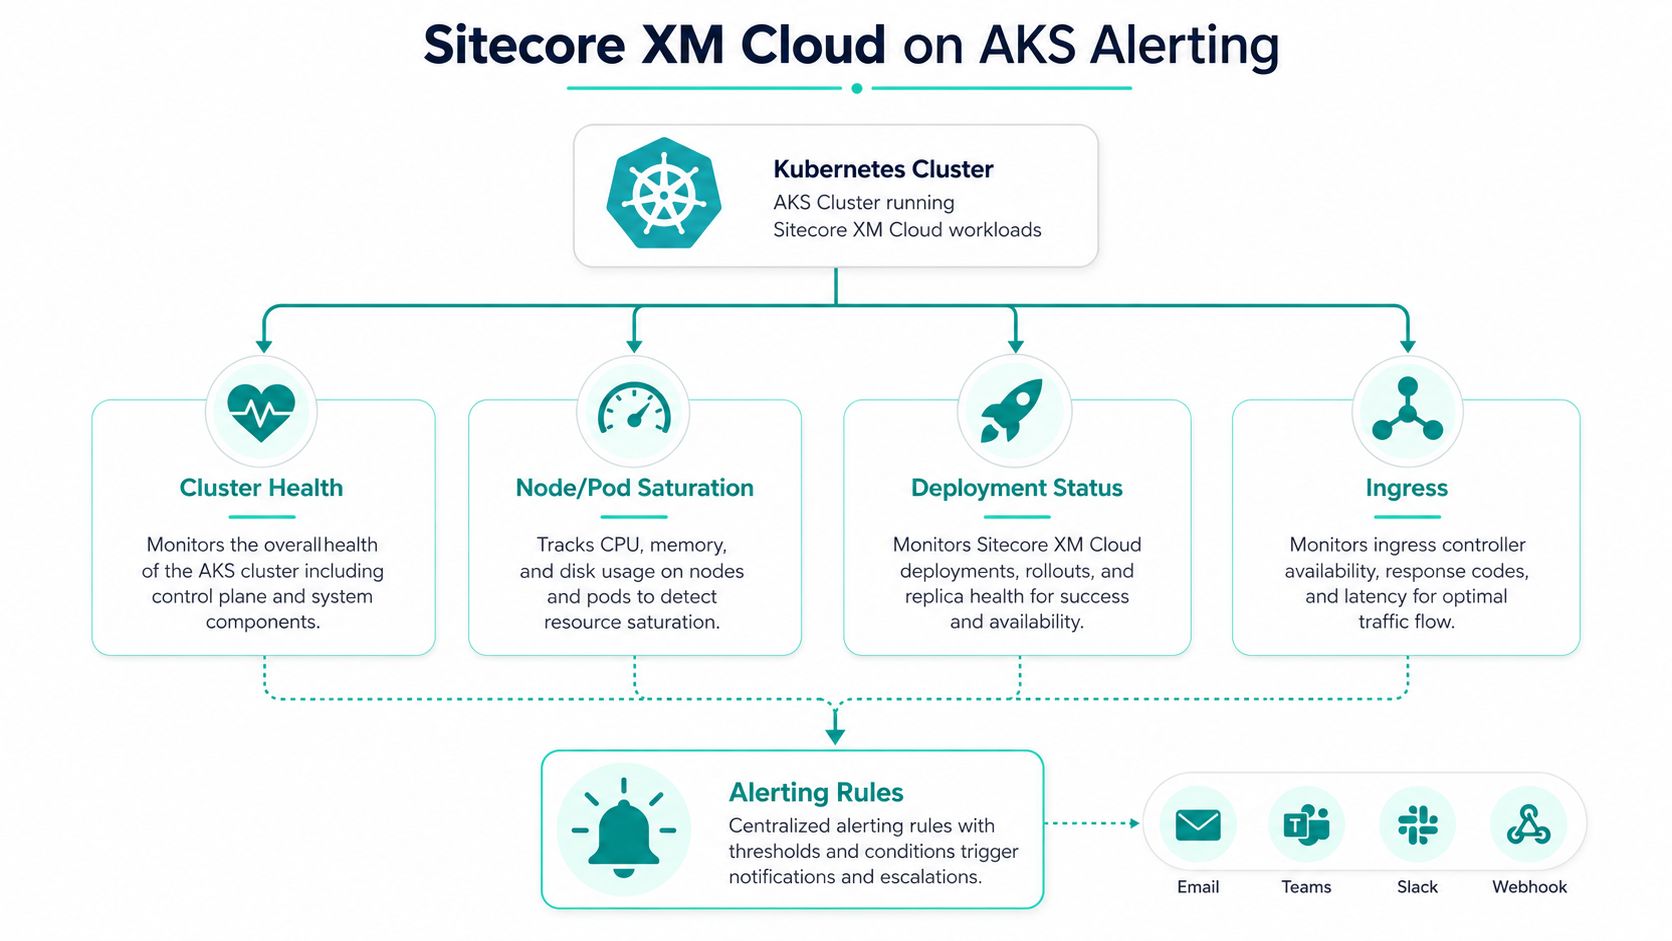
Don't alert on every transient pod restart. Repeated failures, sustained pressure, failed jobs, or a user-visible synthetic check provide stronger evidence than one isolated Kubernetes event.
Sitecore's Stream AI capabilities add another operational dimension. Sitecore describes brand-aware AI, copilots, agents, and agentic workflows across the DXP, including CMS, DAM, and CDP, to support content creation, marketing operations, and project management in its Stream AI capabilities documentation. Alerts around these workflows should protect availability, failed processing, permissions, and integration health without exposing prompt content, customer information, or proprietary campaign data.
SharePoint Online presents a different boundary. For an Azure Function integration, monitor function failures, execution duration, queue age, dead-letter volume, API latency, authentication failures, synchronization status, and stale content. A single throttled request doesn't necessarily justify a page. Sustained degradation, repeated authentication errors, a growing queue, or a failed backup or synchronization process does.
Route high-severity events to on-call responders and lower-priority conditions to an operations channel or dashboard. Tag resources by tenant, workload, environment, and data owner. Keep SharePoint diagnostics inside the appropriate secure service boundary, and use end-to-end synthetic checks to detect the customer or employee experience before support tickets reveal it.
A visual walkthrough of the AKS alerting pattern is available below.
Runbooks and Automation for a Mature Alerting Estate
A mature alerting estate is judged by response speed and signal quality, not by its rule inventory. Severity should map directly to a response path. A critical Sitecore content delivery outage can page the rotation and invoke an approved Logic App for AKS remediation. A low-priority log-search result may only open a Teams thread for the responsible engineer.
Each runbook needs enough structure to work under pressure:
- Trigger source: Identify the rule, resource, state, and correlation identifier.
- Diagnostic queries: Link directly to the KQL, metric, or PromQL evidence needed for triage.
- Decision tree: Separate a deployment fault, capacity issue, dependency failure, and false positive.
- Mitigation steps: Define reversible actions first, with permissions and approval boundaries.
- Escalation contacts: Name the service owner, platform owner, and incident manager.
Link the alert payload to an Azure Runbook, operational wiki page, dashboard, and ITSM record. Avoid embedding sensitive values in the notification itself. The responder should receive context and a safe route to deeper evidence.
Automation worth keeping is narrow and observable. Logic Apps can create ServiceNow or Jira tickets, collect post-incident evidence, and route alerts according to severity. Runbooks can execute known transient mitigations, but they should log every action and stop when preconditions fail. A weekly digest can summarize alert volume by service, ownership gaps, unresolved states, and action-group failures without generating another noisy page.
PowerShell remains useful for repeatable diagnostic and remediation tasks, particularly when teams standardize scripts through source control and review. Guidance on creating PowerShell scripts can help establish that foundation.
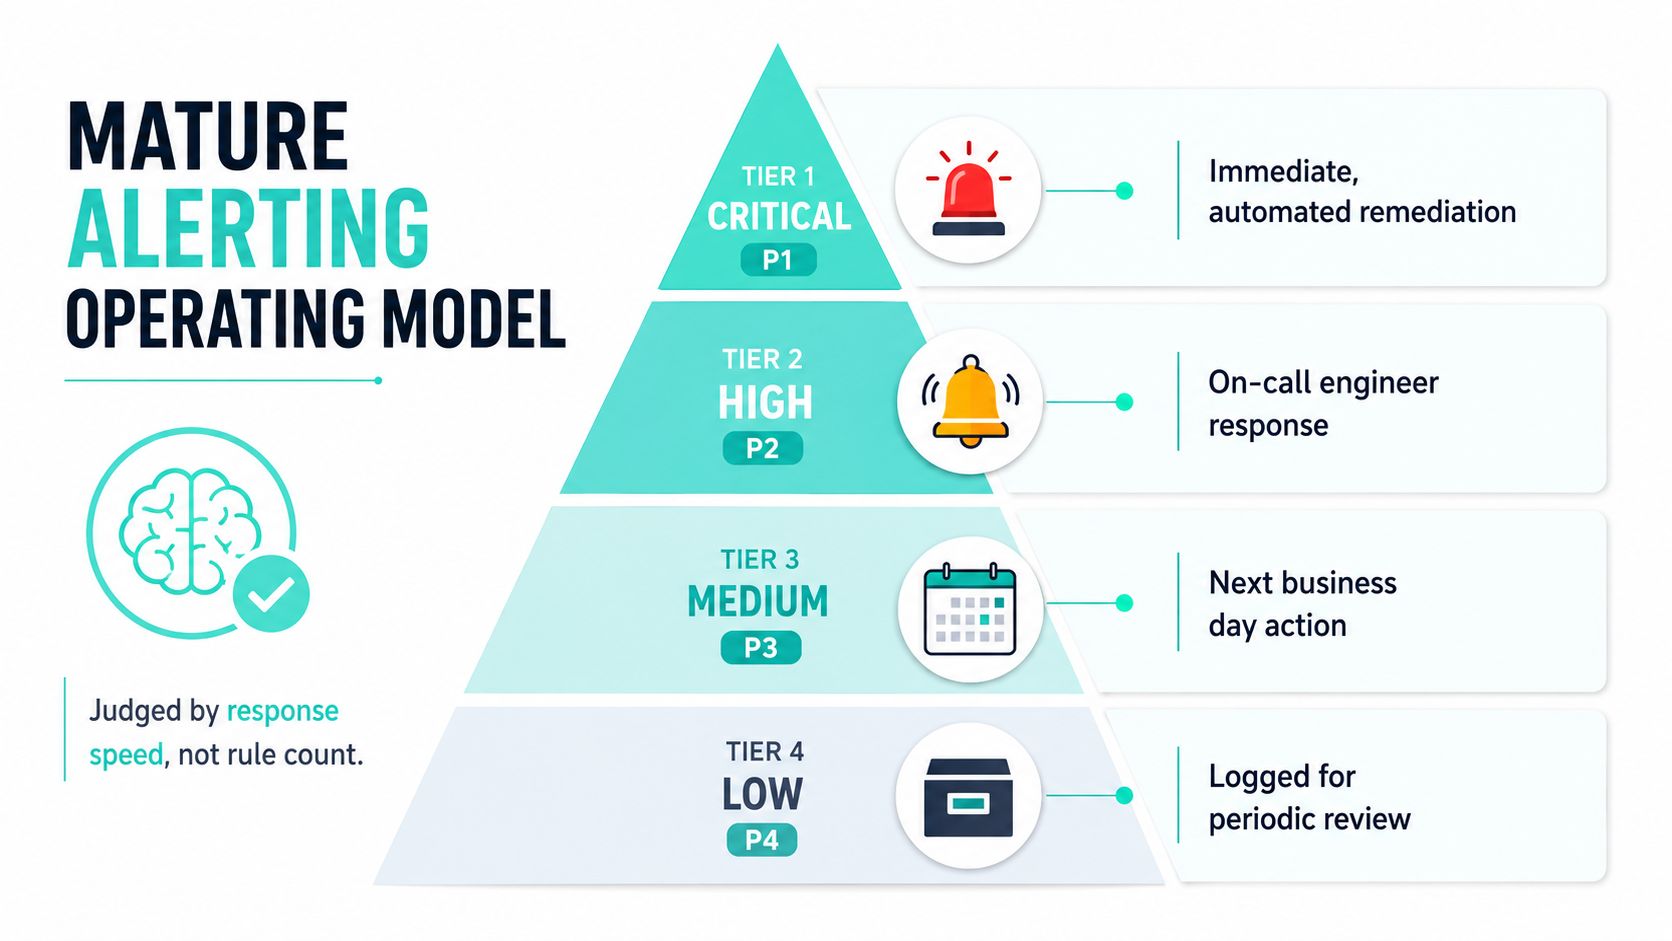
Quarterly audits should verify ownership, rule scope, permissions, action-group delivery, suppression schedules, cost tags, webhook secrets, runbook behavior, and synthetic coverage. Delete abandoned rules. Update runbooks after incidents. Treat every alert change as a production change because it changes how the organization discovers and responds to failure.
Common Misconceptions and Quick FAQ
More alerts don't mean better reliability. A lean rule set with clear ownership usually outperforms a noisy estate because responders can distinguish a page from background evidence. Alert fatigue creates its own operational risk when engineers learn that most notifications require no action.
Metric and log alerts aren't interchangeable. Metrics suit saturation, latency, throughput, and other time-series conditions. Log searches are better for distributed correlation, exception context, and failed jobs. Prometheus alerts are especially useful for Kubernetes behavior and PromQL-based relationships.
Action groups aren't optional plumbing. They attach the response to the rule. A missing or broken webhook can leave an alert technically healthy while incident creation and remediation fail.
Processing rules and suppression differ. Processing rules shape routing, grouping, and enrichment. Suppression prevents selected notifications during an expected period. Neither should become a permanent way to hide an unknown failure.
Prometheus and metric limits need deliberate validation. Query-based metric alerts and Prometheus rule groups can both evaluate PromQL, but their management, scope, and authorization models differ. Review the current service behavior before assuming that one limit or operational pattern applies identically to both.
Dynamic thresholds need usable history. Sparse or irregular data can produce weak baselines. Static boundaries remain better for finite obligations such as certificate expiry or queue age.
An unused rule still has operational cost. It consumes review capacity, adds ownership ambiguity, and can contribute to monitored time series, query activity, or notification noise. Activity log alerts won't catch application-layer publishing or synchronization faults.
Alerting maturity is measured by the quality of the signal and the response it enables, not by the number of rules deployed.
Kogifi designs, builds, and supports enterprise Sitecore XM Cloud, Sitecore AI-enabled DXP, and Microsoft 365 SharePoint platforms with Azure monitoring, automation, and incident-response practices aligned to real workloads. Visit Kogifi to discuss an alerting assessment, platform stabilization plan, or managed support model for your DXP estate.